Home Energy Analysis Light v1
The Home Energy Analysis Light v1 widget encourages customers to complete the Home Energy Analysis v1 survey if they have not taken it already, and displays an energy use disaggregation for customers who have completed the survey. The disaggregation is shown as a pie chart and is included in the Smart Dashboard.
On this page:
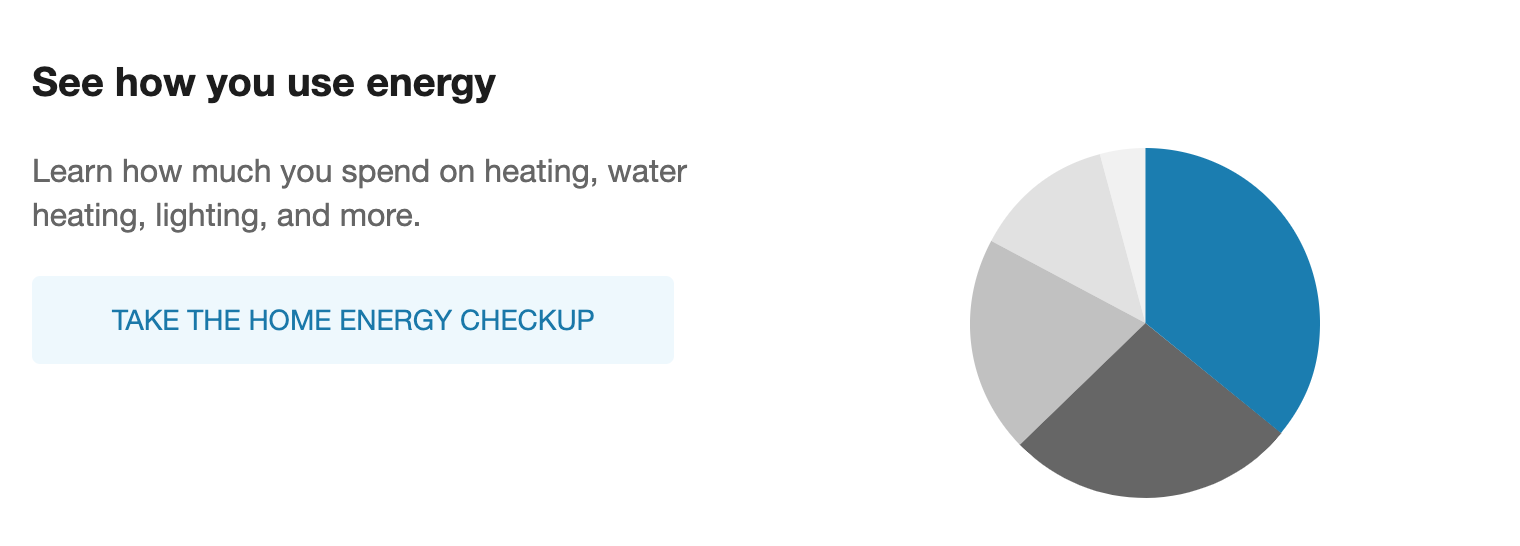
Survey Prompt
If the customer has not started the Home Energy Analysis v1 survey, then the Home Energy Analysis Light v1 widget shows a prompt to encourage survey completion. The appearance of the prompt is the same whether the customer has not started the survey, or started but not completed the survey.
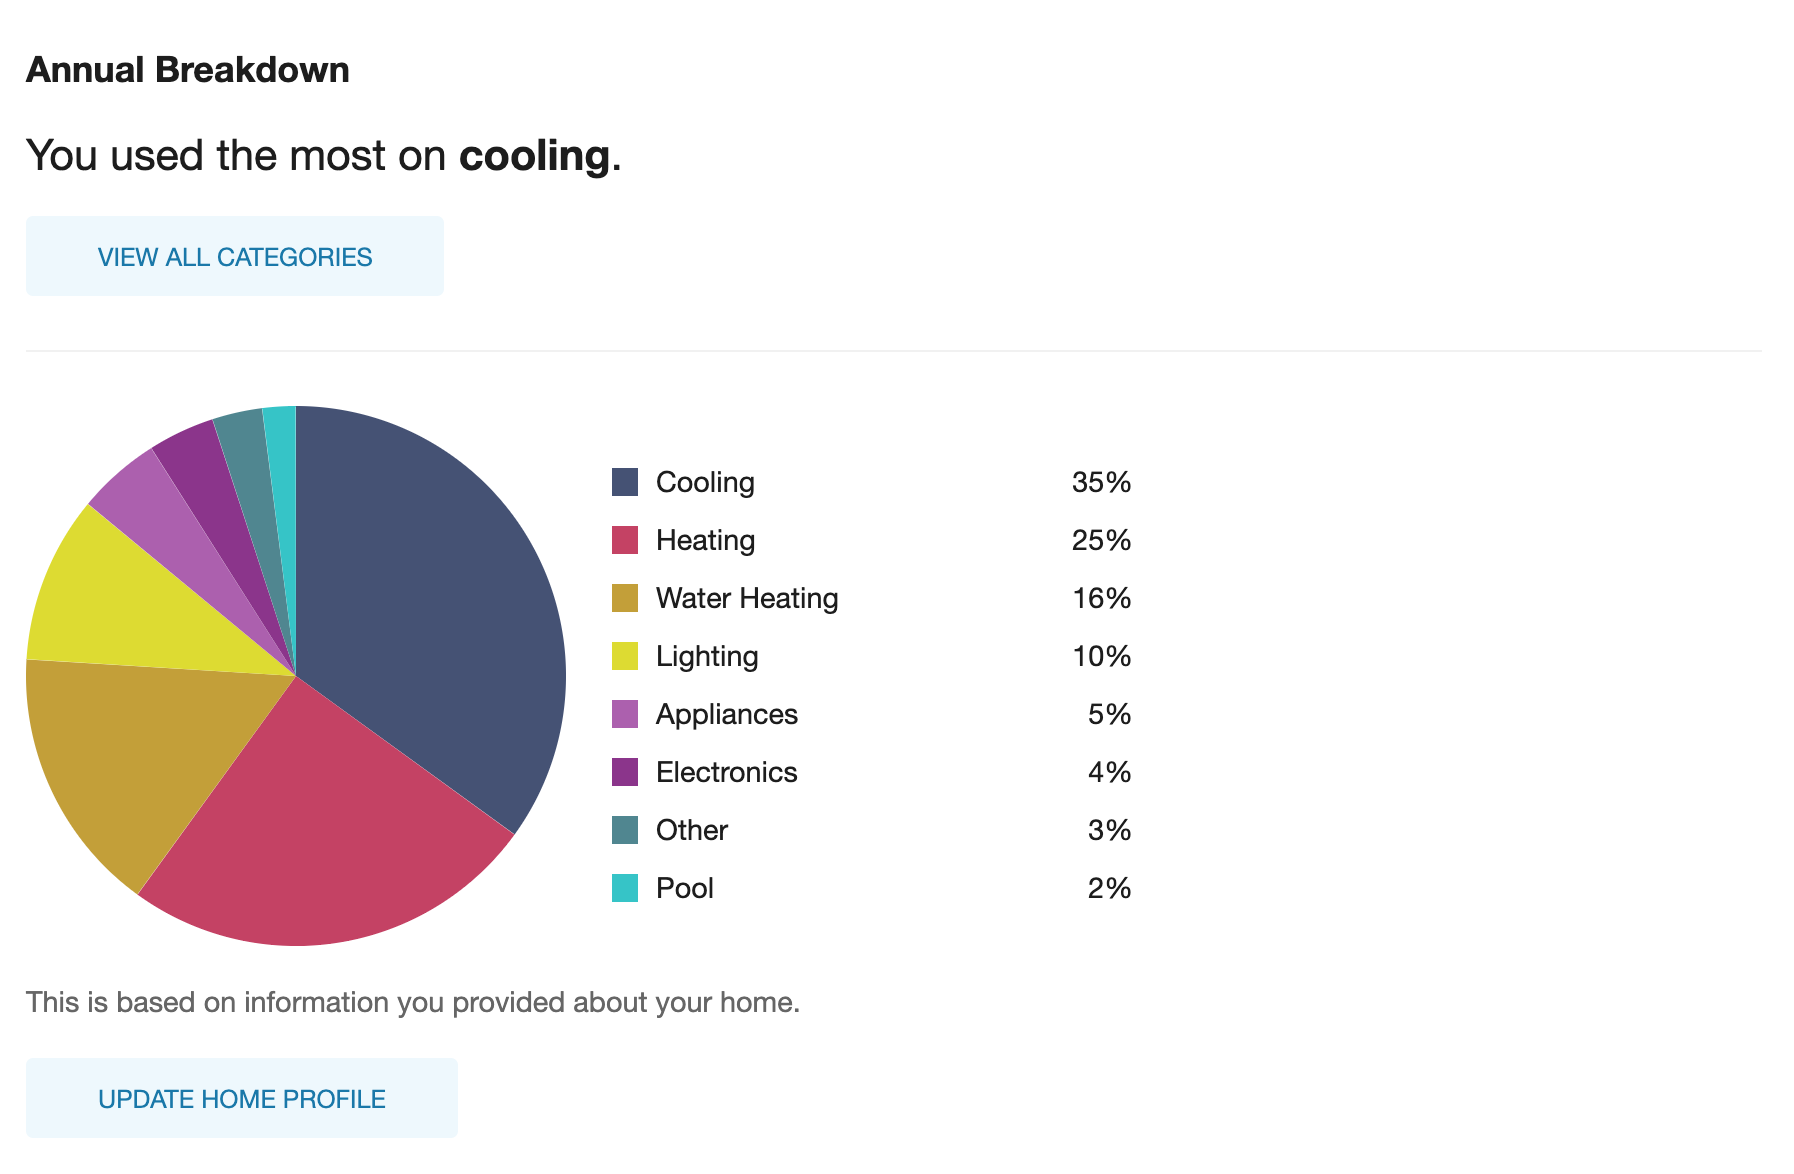
Disaggregation
If the customer has completed the survey, then the Home Energy Analysis Light v1 widget is updated to display an energy use disaggregation in the form of the pie chart. Compared to the full Home Energy Analysis v1 experience, the Home Energy Analysis Light v1 disaggregation includes the following differences:
- The View All Categories link directs the customer to the full HEA v1 disaggregation experience
- The pie chart categories are not interactive
- Only an annual time resolution can be shown (a bill-level disaggregation cannot be shown)
Requirements and Limitations
The data requirements for Home Energy Analysis Light v1 are the same as those described in Home Energy Analysis v1.
Note: Home Energy Analysis Light v1 can only be shown in the Smart Dashboard and is not embeddable on other utility-hosted web pages.