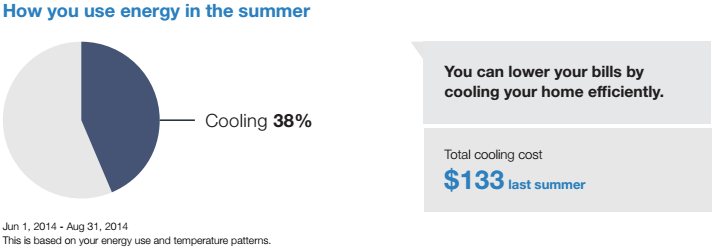
Cooling Analysis Pie Chart
The Cooling Analysis Pie Chart displays the customer's estimated cooling usage last season as a percentage of their total energy consumption. Its purpose is to help customers better understand how they use energy during the cooling season. A brief message indicates their estimated cooling costs. If the customer used less than $10 in cooling last summer or does not have any costs associated with their usage reads from the previous summer, the total cooling cost will not be shown.

Fuel: Electric-only and dual fuel
AMI Data Required: No
Data History:
- At least 12 bills in last 18 months or at least 6 bills with positive Cooling Degree Days and 6 bills with negative Heating Degree Days.
- Usage data from last summer
Billing Frequency: Monthly or bi-monthly
Configuration Options:
- Primary and secondary colors are configured based on utility branding guidelines
- Module title and messaging