Monitoring Client Machines
It is recommended to use the Internet Explorer browser or any operating system monitoring specified by Microsoft to yield performance information from the client.
While collecting this information can be performed using various tools, it is usually not applicable in all monitoring situations unless the client machine is below the specification outlined in the Installation Guide for the platform and version of the product you are using. The browser collection points specified here are typically the ones that are better tailored for Oracle Utilities Application Framework’s client.
Refer to the Microsoft documentation on how to fully monitor a client machine for performance information.
Monitoring the Desktop
One of the areas that customers tend to monitor is the desktop client. Typically this involves using tools provided by Microsoft (and other vendors) to collect typical statistics, such as CPU, disk activity, memory usage and network usage. It is possible to monitor the client using the following tools:
• Desktop Vendor Tools (Performance Monitor) – The Performance Monitor (located in the Administration Tools menu from Windows) is a starting point for monitoring the client. Refer to Microsoft documentation on what aspects of a client machine to monitor.
• Network Monitor (netMon or other) – Windows Server includes a network capture facility that is handy to locate problems on a client machine. Alternatives, such as Ethereal, are available.
• Network Latency - Network tools like ping and traceroute measure latency by determining the time it takes a given network packet to travel from source to destination and back, the so-called round-trip time. Round-trip time is not the only way to specify latency, but it is the most common. Inconsistent ping times or long ping times can indicate network issues.
• Bandwidth Saturation levels - A number of tools exist for computer networkers to measure the bandwidth of network connections. On LANs, these tools include netperf and ttcp.
• Packet Loss - Packet loss is when data packets appear to be transmitted correctly at one end of a connection, but never arrive at the other. This might be because:
• Network conditions are poor and the packet became damaged in transit.
• The packet was deliberately dropped at a router because of congestion.
• Packet loss can be detected from the client PC using netstat and calculating the percentage of the Segments Sent that become Segments Retransmitted.
Note: ping and traceroute also include packet loss statistics.
• Failed Connection Attempts - When the client or server cannot accept a connection, this generates a Failed Connection Attempt on either the client or the server (or both). A large number of Failed Connection Attempts can indicate networking or capacity issues on the client or server. The most common cause is that the accept queue on the network parameters (usually on the network cards) is full, and there are come requests waiting on the sync queue (usually on the network card).
Client Debug Facility
Before a problem is to be registered with Oracle Support, the transaction that caused the problem should be traced to help support solve the issue quickly. A debug facility is provided within your application to help capture this additional information.
Logging of debug information can be set at a global level or at a local level. The global debug setting is not recommended for a production system as it reduces overall performance and therefore is not covered in this document.
The local level enables you to navigate to the problem area and then to switch debugging on for that individual user to recreate the problem. You can then collate the debug information to be sent to support.
To use this facility, you must specify an additional parameter at the end of the URL. For example:
http://<host>:<port>/<server>/cis.jsp?debug=true
Where:
<host> | Web Application Server hostname. |
<port> | Port allocated to product installation. |
<server> | Context for the product at installation time. |
Note: For the user to have debug access, their userid must have Change access to service F1DEBUG.
After the debug control menu is displayed, you navigate to the screen where the problem is encountered and then enable Global Debug by toggling the checkbox on. To turn off Global Debug, toggle the check box off. It is recommended to select Trace All for effective tracing. The other options are used by developers only. The trace information is written to the spl*.log in the $SPLSYSTEMLOGS.
Note: The product uses spl_web-user.log and spl_service-user.log but spl_service-user.log may or not appear depending on the installation type, therefore the name spl*.log is used.
All the logs displayed under this feature pertain to business/user logs. No technical logs would be displayed.
Debug allows specific information to be logged:
• Client Data – Data presented to the browser. This pops up an additional window displaying the object as it is built.
• Server Data – Data presented to the server. This pops up an additional window displaying the object as it is received by the server.
• Trace time – Include time tracing in the log.
• Trace All – Enable all trace modes below except Trace SQL Parameters.
• Trace Output – Dump output from all calls
• Trace SQL – Dump SQL statements
• Trace SQL Parameters – Dump all result sets (Warning: This is not recommended for production systems as it will result in performance degradation.)
• Program Start – Write a record for every module start.
• Program End – Write a record for every module end.
Most tracing in non-development uses Trace All unless otherwise instructed by Oracle Support. All debug information is written to the spl*.log files.
Steps to Using the Debug Facility
To use the debug facility you follow the process:
• Add ?debug=true to the URL for your application. This will display the debug icon on the browser screen as shown below: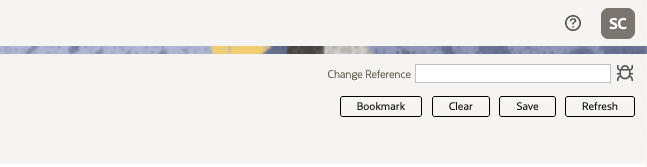
• Click on the debug icon to display the debug toolbar.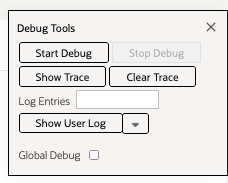
• Start Debug – Start the logging of the transaction.
• Stop Debug – Stop the logging process.
• Show Trace – Show trace information (configuration-based objects only).
• Clear Trace – Clear trace information.
• Show User Log – Show debug information for the user (line limit is configurable).
• Show Log – Show log for all users (applicable for administrator). Can be selected from the Show User Log drop-down.
• Global Debug – Set debug level.
• Select Global Debug to specify the level of debug information. This will display the Debug Control window where you should ensure that Trace All is selected. Other options should only be used if instructed by Oracle Support. A sample of the Debug Control dialog is shown below: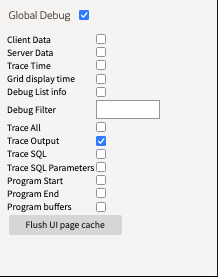
• Navigate to the transaction that you wish to trace as a user would normally operate. Press Start Debug to initiate debug.
• Run the transaction that you want to trace and to recreate the issue. While you work the trace information is written to the log files.
• Deselect Global Debug or press Stop Debug so that debugging is disabled. This will stop debug code from writing to the log. If you select Show User Log the log lines output by the debug facility are displayed (up to the line limit specified). This will only show lines applicable to the Current User only.
Note: If the userid is shared across multiple physical users then the information may contain debug information from multiple sessions.