Enhancements in Version 2.5.0.2
New and enhanced features in Oracle Utilities Network Management System Version 2.5.0.2.
AMI Integration
Support separate meter status columns for solicited and unsolicited
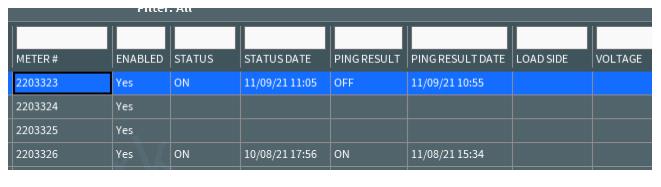
The AMI Customers tab now has separate columns for solicited meter statuses from ping requests (Ping Result, Result Date) and unsolicited meter statuses from last gasp power-offs and first breath power-ups (Status, Status Date). The AMI Power History will indicate whether or not the status was solicited.
Improve support for "UNKNOWN" meter status response
Previously if an UNKNOWN meter status was received it could optionally be stored but could not satisfy a meter ping request. NMS would continue to ping the meter until an ON or OFF status was received or the maximum number of attempts were made. Now an UNKNOWN status can satisfy the ping request and no further pings will be sent for that request.
Auto-refresh of ping results
Previously the AMI Customers table and AMI Requests window did not dynamically refresh when ping results were returned, requiring a user to manually hit a Refresh option periodically to see if responses were received. The ping results now dynamically refresh and update the AMI Customers table and AMI Requests window.
Distributed Energy Resource Management (DERMS)
Multi-temporal Optimization for Network Capacity Allocation (NCA)
NCA clears flexibility service bids for areas with high DER penetration. It ensures that the services being offered will not cause network constraints. Previously the NCA analysis checked for overload violations. The new multi-temporal optimization engine enables NCA to check for overload and voltage violations. Additionally, the duration required to perform a NCA analysis has been greatly reduced.
Fault Location, Isolation, & Service Restoration (FLISR)
Bus fault restoration logic
Bus fault protection triggers when a fault occurs on or close to the substation bus (x-protection), or when a breaker fails to operate and backup bus protection is triggered (y-protection).
When x-protection is triggered, FLISR assumes that the fault is either on the bus or close to the bus. In this scenario, FLISR will open the first downstream SCADA operable switches and restore using adjacent feeder ties.
When y-protection is triggered the protection scheme will attempt to open all the breakers on the bus, including the breaker that did not trip open for the fault. FLISR will first check if all the breakers on the bus have opened. If the breakers have opened, then FLISR will close the unfaulted feeders and bus tie (if it is nominally closed), then open the first switch without fault indication on the faulted feeder and restore with adjacent feeder ties. If the faulted feeder breaker was not opened by the y-protection scheme, the FLISR will open the first unfaulted switch on the faulted feeder, and the first downstream switch on the unfaulted feeders and restore with adjacent feeder ties.
Fault Location Analysis
Momentary and Sustained Processing
FLA events are now categorized as sustained or momentary. A FLA momentary event mean that the fault was temporary and that the reporting protective device successfully reclosed. A FLA sustained event means that the fault was present for long enough for the protective device to trip to lock out.
FLA can now be configured to process momentary and sustained, sustained only, or be disabled. New FLA global and feeder level modes have been added:
• Enabled for sustained and momentary
• Enabled for sustained
• Disabled
The most restrictive mode between global and feeder will take precedence.
Model Management
Schematica Enhancements
Two improvements were made to the schematics generation module Schematica.
1. Display of switch gear boxes: network components that are part of the same switch gear box will have a box drawn around them in the generated schematic diagram to visually indicate this.
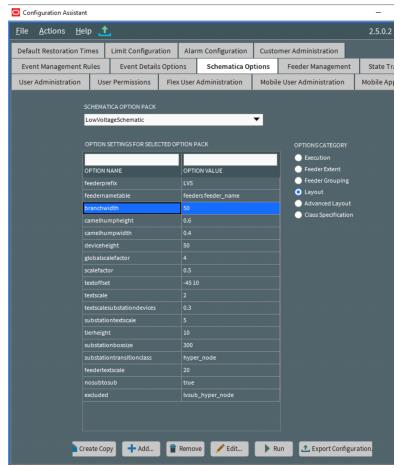
2. Configuration of parameters for schematics generation: previously these were command-line arguments to the schematica program. A new tab has been added to the Configuration Assistant to allow the user to choose among predefined option packages, edit or save a new option package, easily view and modify parameters, and run the schematic generation.
Operations Mobile Application (OMA)
Migrate OMA to PWA technology
The Operations Mobile Application (OMA) is moved from a hybrid application to a Progressive Web App (PWA). This greatly simplifies the building and deploying of OMA as it can be built once on any platform supporting NodeJS and then is installed from a web server via Chromium browsers (Google Chrome or Microsoft Edge) on Windows, Android or Linux platforms, and via Safari browsers on iOS and MacOS. All Cordova plug-ins have been replaced with standard web components as part of this move to the PWA technology.
Optimization
Measurement and Verification (M&V) Data
VVO now captures additional data that can be used for M&V analysis, specifically for the CVR objective. Utilities are required to report the benefits of CVR to their regulators. There are various methodologies that utilities use to estimate the performance of their CVR programs. Some of the key metrics include: average voltage reduction, average load reduction, CVR factor, and estimated energy savings. To generate these metrics utilities will often run an evaluation period where they will turn CVR on and off periodically to estimate the load and voltage reduction. NMS now captures the following data for each substation bus and feeder whenever power flow solves:
• VVO mode
• Min/Max/Avergage measured voltage by phase
• Feeder head kW and kVAR by phase
• DER kW/kVAr output by phase
• Line losses by phase
• Weather data
• Customers connected to feeder
• Abnormal devices
This data can be exported to a CSV file from Feeder Load Management.
SCADA
NMS v2.5.0.2 provides numerous significant enhancements around SCADA. The main enhancements are described below.
Active Alarms Display
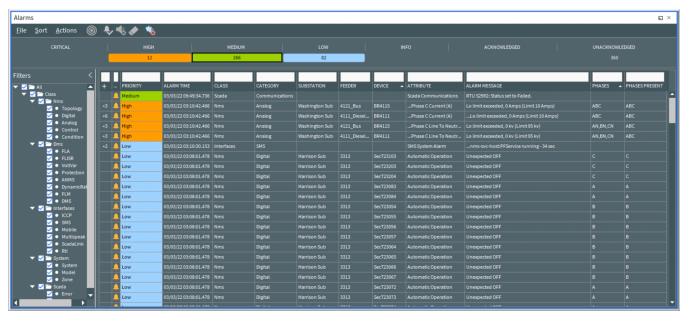
New features have been added to the Active Alarm Display to help inform the user on the current status of existing alarms in the system. These are:
• The alarms will now be sorted by the Alarm Insert Time in descending order by default. This ensures that when the display is invoked, it will present the most recent alarms to the user.
• A new column has been added to the display to show the acknowledgement status of the alarm.
• Show or hide the milliseconds display in time fields for clarity.
• Multiple analog alarms for different phases on a device shall be grouped under one parent alarm.
• Added information on the number of child alarms when viewing the main alarm list.
• An indication will be given to the user when the alarm display has been filtered.
• The alarm display can be filtered on priority or acknowledgment status by selecting columns in the alarm banner.
Multiple active alarm displays can be initiated from different locations within NMS. There are options to open an alarm display for a device location from:
• The Control Tool.
• The SCADA Summary Tool.
• A device or substation in the viewer.
By default, conditional formatting has been applied for alarm priorities on the following displays. These can be changed if required:
• Active Alarms Banner
• Active Alarms List
• Alarm History List
• Alarm Definitions table
Provided with this release is a migration script. This script will allow existing alarms to be re-configured to the new format to prevent the need for reconfiguring existing alarms or notifications.
Alarm History Display
A new display has been included in NMS that provides the user with the ability to view alarm history. A historical alarm is one that may have been viewed or superseded in the main active alarm display or a lower priority alarm that does not require acknowledgment, but is required for auditing purposes. This display can then be filtered on a device or location to review all the alarms that have been raised in association with the selection.
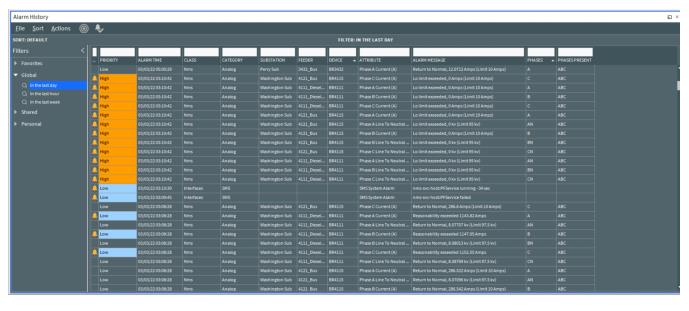
The Alarm History Display has similar features to the Active Alarm Display. The display can be filtered using column headers but also has a selection of Global filters which allow the user to select alarms in the last day, hour or week. Additionally, users have the ability to create their own alarm views through the ability to create their own private filter that can then be shared with other users or added to their own Favorites.
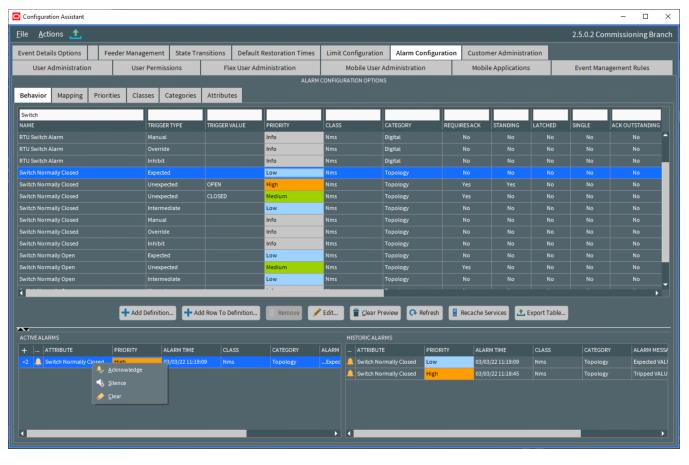
Alarm Configuration
Additional functionality has been added to the Alarm Configuration tool in the Configuration Assistant. As alarms are configured a new alarm preview tab has been added that will allow users to visualize how alarms will appear in both the Active and Historic Alarm displays. Users can select an alarm from the alarm list and choose to preview in the display. They can also choose to acknowledge alarms in the preview tab to further identify how alarms will behave under the defined configuration. When they have completed the checks, the alarms can then be removed from the preview.
SCADA Limits Processing
The functionality around limits has been enhanced with the ability to configure and manage limits being made available within the Configuration Assistant tool. The ability to apply limit groups has been added which provide a set of limits that can be applied. These limit sets describe a range of limits that can be applied to a measurement for example, limit sets that are aligned to seasons. The limits can be defined by either absolute values or percentage values based on a nominal value, a device attribute or a SCADA measurement.
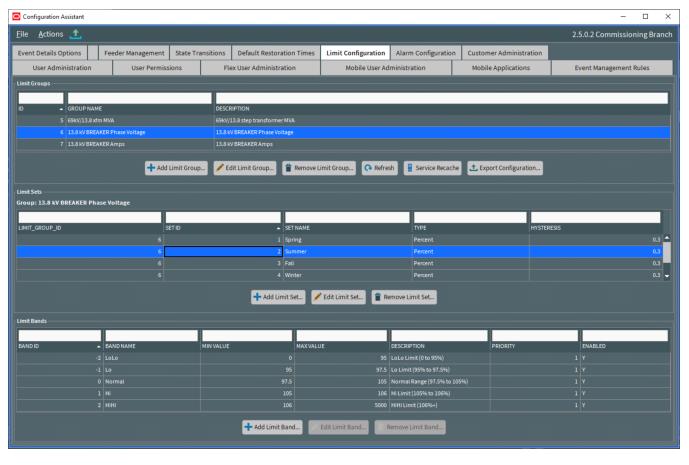
When the alarm limit bands are traversed, the system includes the ability to raise an alarm to inform users that the relevant measurement has gone higher or lower than the normal value defined in the limits. These alarms can be grouped and automatically acknowledged in the Active Alarm Display, through configuration.
In order to prevent alarms being raised when a measurement value continually moves above and below a limit band value in small increments, the system has a hysteresis value that can be applied. So when moving down a band from a high limit or moving up a band from a low limit, an alarm will only be raised when the new value is greater than the band limit plus the hysteresis value.
SCADA Summary Updates
The SCADA summary display has been updated to display the current Limit Group and Limit Set that have been applied to a device. An option has been added that will allow the user to change the Limit Set that has been applied.
There may also be a need, in some circumstances, to provide a temporary set of limits to a measurement. The ability to apply a temporary override of limit values is also available. The user can select to apply the temporary limit, define the temporary value and how long this temporary value should be applied for.
Integrated SCADA Commissioning Functionality
Oracle NMS 2.5.0.2 contains new functionality to enable the configuration, management and control of SCADA-enabled devices directly from NMS. Access to the SCADA Commissioning functionality mentioned here is privilege-controlled. Only user types with the appropriate membership granted will be able to access this functionality.
Create, Configure, and Monitor the SCADA system
The SCADA Status tool provides the ability to oversee the SCADA system. The display will provide the user with the ability to identify the current status of the SCADA system communication with the field devices. It will also provide the ability to:
• Create, configure and remove Front End Processors (FEPs), Remote Terminal Units (RTUs) and individual points for monitoring and controlling field devices.
• Enable and disable FEPs, RTUs and points and switch between multiple connections to the devices (for example, main and backup side of a FEP).
• Associate SCADA controlled devices in the NMS network to output points to allow for remote control and display the updated status on the network diagram
• Associate network devices in the NMS to input points to associate analog readings from the field and display on the network diagram
• Review and reset statistics for FEPs such as the number of analog and digital changes and the rate of change for analogs and digitals.
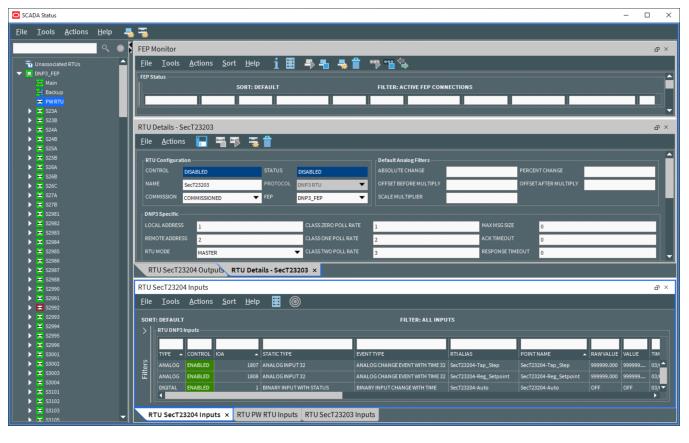
Protocol Support
Remote Terminal Units can be assigned a protocol with which it communicates with the field devices. Support has been added for the ICCP, DNP3 and IEC 104 protocols in this release. When a protocol is defined for an RTU, the RTU details screen is updated to display the relevant configuration options for the selected protocol.
Support Commissioning States
The ability to define the commissioned state of a SCADA-enabled device has been added. This allows the ability to define RTUs and individual points as either:
• Commissioned
• Tested
• Uncommissioned
• Decommissioned
SCADA Commissioning Templates
The ability to define templates which will include information on the network devices and points to be associated with the SCADA information has been added. When generating the SCADA information for an RTU, for example, the most relevant template can be selected and applied to the RTU allowing for the automatic creation and, where possible, linking to existing network devices.
User Experience (UX)
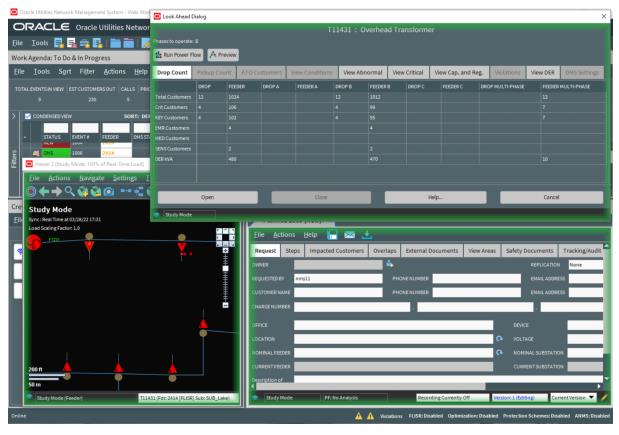
Clearer visual differentiation between Real-Time and Study modes
NMS has improved the indication for when a window is in Study mode. A configurable green gradient border is around windows and dialogs that are in study mode, whereas the windows have no gradient border in real-time mode.
Affected windows and dialogs include:
• Viewer
• Trace
• Control Tool
• Look Ahead
• Switching Sheets
• Safety Documents
• Feeder Load Summary
• Feeder Load Management
• Feeder Details
• Study Session Parameters
• Commissioning Tool
• Storm Management
Web Switching Management (WSW)
Ability to export/import switching sheets
NMS now allows the export and subsequent import of switching sheets. This can be helpful when you want to export training scenario sheets prior to updating a training environment and then import them back, or copy a switching sheet from production to a non-production environment for testing or troubleshooting. This feature is available for training scenarios, templates, planned, and emergency switching sheet types. Sheets are exported in a .json format and can be viewed by any application able to view .json files.
Web Workspace (WW)
Ability to display filled polygons in viewer
Added support for polygons in the NMS model. Projects can now add polygons to the model and display them in the viewer with a custom fill pattern, color and opacity specified in the device attributes. One example is the calculation of Fire Potential in an area and being able to display polygons filled or colored to indicate the level of risk for the specified polygon region.