Storm Mode Algorithm Flow Chart
The yellow boxes indicate where the storm mode algorithm differs from the non-storm mode algorithm.
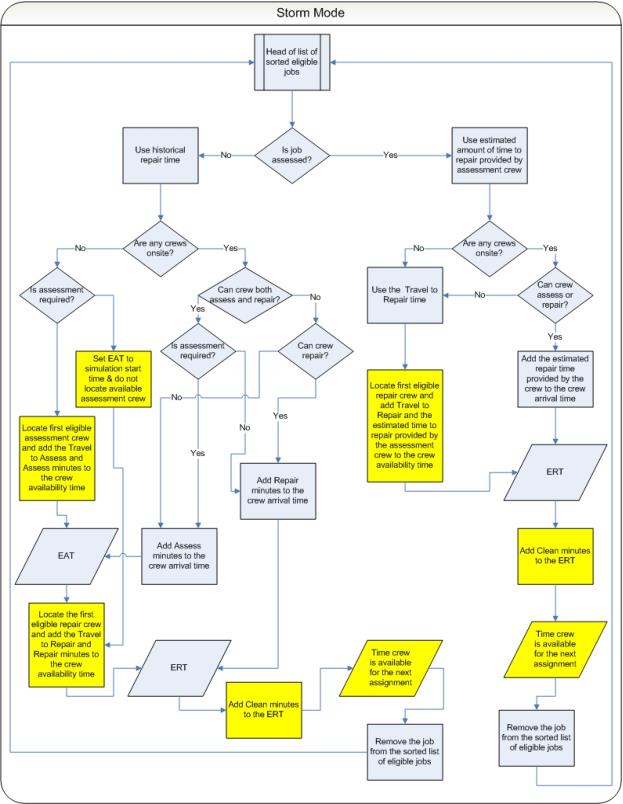
In summary, for an event that's in a control zone operating under storm mode:
Estimated assessment time =
• The time at which the first crew that's eligible to assess the event will become available +
• the historical average number of minutes it takes an assessment crew to arrive onsite +
• the historical average number of minutes it takes a crew to perform assessment once onsite
Estimated restoration time =
• The time at which the first crew that's eligible to repair the event will become available after the estimated assessment time +
• the historical average number of minutes it takes a repair crew to arrive onsite +
• the historical average number of minutes it takes a crew to repair once onsite =
Exceptions:
If a crew that can perform assessment is already onsite,
Estimated assessment time =
• The time at which the assessment crew arrived onsite +
• the historical average number of minutes it takes a crew to perform assessment once onsite
If an event has an actual assessment provided and no repair crew is yet onsite:
Estimated restoration time =
• The time at which the first crew that's eligible to repair the event will become available after the actual assessment time +
• the historical average number of minutes it takes a repair crew to arrive onsite +
• the actual number of minutes it will take to repair, per the assessment
Estimated restoration time =
• If an event has an actual assessment provided and a repair crew is already onsite,
• The time at which the repair crew arrived onsite +
• the actual number of minutes it will take to repair, per the assessment
If an event does not require assessment and no repair crew is yet onsite:
Estimated restoration time =
• The time at which the first crew that's eligible to repair the event will become available after the time at which the simulation iteration started +
• the historical average number of minutes it takes a repair crew to arrive onsite +
• the historical average number of minutes it takes a crew to repair once onsite
Notes:
• When the historical averages are applied to the calculation, the average that applies to the conditions at the time the particular step is projected to begin is used, not the average that applies to the conditions at the time the simulation iteration began. For example, Shift A has a particular average value for repair, and Shift B has a different average value for repair. The simulation iteration is in Shift A, but the calculated estimated assessment time falls in Shift B. When calculating the estimated restoration time, the historical average value for repair that pertains to Shift B will be used, not that of Shift A, because the repair isn't projected to begin until sometime during Shift B.
• If the algorithm finds that the calculated estimated assessment time or estimated restoration time would fall beyond the end of the shift of the first eligible crew by more than 60 minutes, it will go back and recalculate the estimate using a different crew other than the one that was originally chosen. The algorithm cannot split work for a single event between multiple shifts of the same crew or between multiple crews. As a consequence, if amount of work required for an event is more than the longest available shift of any crew capable of performing the work then the algorithm will not be able to provide a meaningful ERT for the event. At this point, the algorithm will use "default nominal crew" as a fall back mechanism in order to proceed. This is an artificial crew that can perform any work and not limited by shift restrictions. ERTs generated through use of "default nominal crew" are of no practical value and a warning is written into JMService log file each time this occurs.