Menus and Toolbar Buttons
File Menu
Menu Option | Description | Toolbar Icon |
|---|---|---|
Refresh | Refreshes the data in the Trend Graph window with the selected control zone's data. | |
Print... | Prints the trend graph for the selected region. | |
Pin | Click to pin the graph, which will open new graphs in separate windows. If a graph is not pinned, then when the Trend Graph option is selected again, the current window will display the data for the new selection. Note: You may pin multiple graphs. | |
Exit | Closes the Trend Graph window. | -- |
Help Menu
Menu Option | Description | Toolbar Icon |
|---|---|---|
Graph Tool Help... | Opens the online help system to the Trend Graph help content. | -- |
The graph will show the predicted values and the actual measurements over the given period of time. If a measurement is done for an attribute that has multiple phases, all of the phases will be shown on the graph.
The start and end dates can be changed by selecting a date and time in the Begin Date and End Date fields.
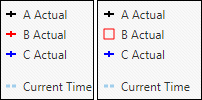
Lines can be hidden by deselecting the symbol in the legend:
If you hover the mouse over a point on the graph, the details of the measurement will be shown.