Graphical View Tab
The Graphical View tab is active when you initially start the Feeder Load Management tool. The Graphical View allows you to quickly see the trends in the forecasted data.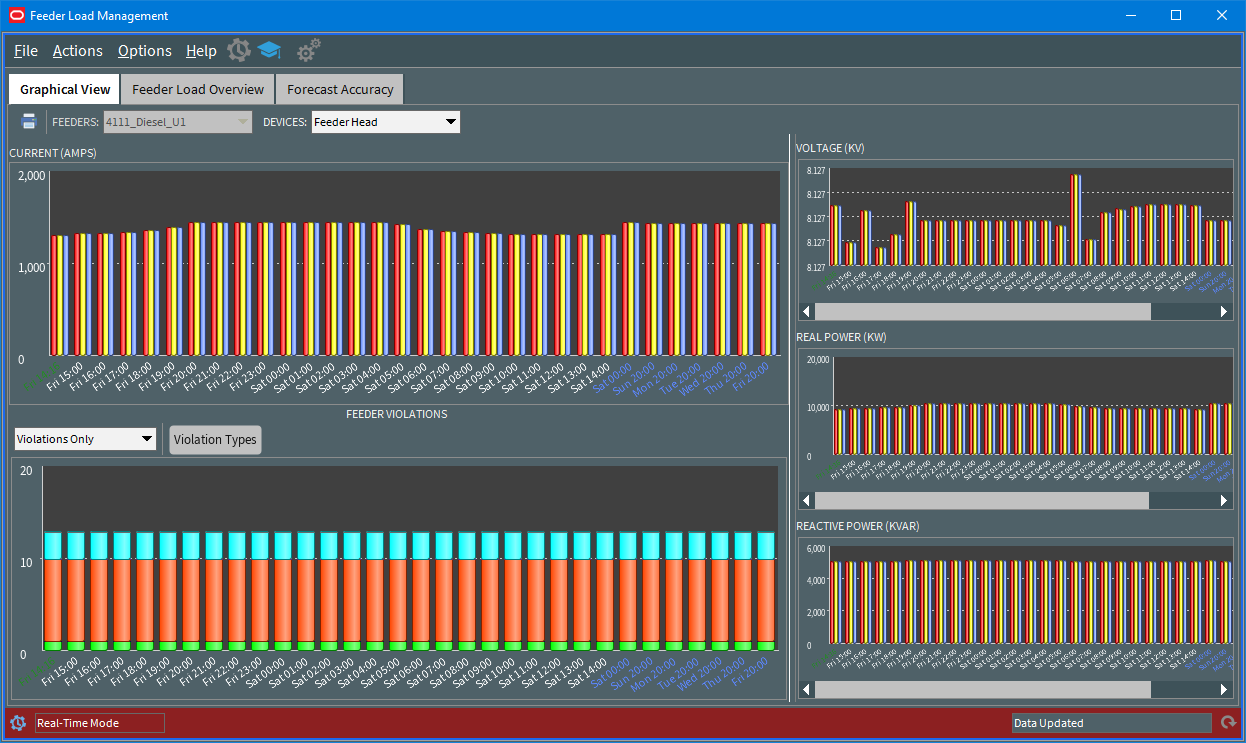
Use the Feeder option menu to display data for a different feeder, if the Feeder Load Management Tool is showing results for more than one feeder. Use the Devices option menu to display data for a signification device on the feeder; Feeder Head is the default selection.
The Graphical View shows five different graphs:
• Current
• Feeder Violations
• Voltages
• Real Power
• Reactive Power
For the currents, voltages, and power graphs, the bar graphs show three bars, representing results data for three phases.
• The X axis displays the time of the forecast, with values for real-time loading, 24-hour forecast values, and 6 daily peak forecasts.
• The axis label colors are based on forecast type and are consistent with the colors used on the Date/Time column of the tabular display.
• Use the slider between the left side of the tab (displaying the Current and Violations) and the right side of the tab (displaying Voltage and Power) to resize the graphs.
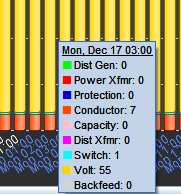
When you hover over a point on a graph, a hover text box displays the actual data values, as shown below: