Example DERMS Event
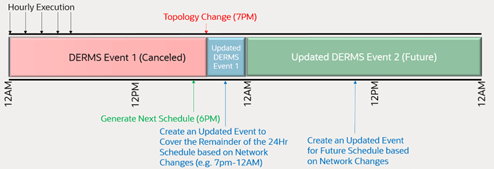
The below depicts an example DERMS event situation where an event covers a time horizon of 12am - 12am and the scheduled solution time is at 6pm the prior day.
Stage 1: Normal Execution of Active Plan
We have an active event that is being executed it covers 12am - 12am for the current day.

Stage 2: Scheduled Creation of Future Plan
Execution of the switching plan continues for each hour, when 6pm is reached a new DERMs event for the same area is created to cover tomorrow from 12am -12am Note DERMS still continues executing the active plan for the current day.

Stage 3: Unexpected Topology Change
Execution continues to progress but at 7pm a topology change on the network occurs that impacts the DERMS area. At this point multiple things happen:
1. A new plan is created to cover the remainder of today (for example, 7pm - 12am today) and the old event is canceled
2. A new future event is created (for example, 12am-12am tomorrow) as the one created at 6pm is no longer relevant due to the topology change and the old one canceled.

Aborting an Optimization Plan
To abort a DERMS plan from the Work Agenda, right-click the DERMS event and select Abort DMS Processing from the context menu.
Alternatively, in the DERMS switching plan, right-click the DERMS event in the Events table and select Abort DMS Processing from the context menu.
Understanding the Number of Retries for a Timed Out Step
If no response (related to a plan's switching action) is received from SCADA within the configured timeout period, then the switch step status will be set to a value of Failed. When the DERMS plan is executed in automatic mode, or when the plan is manually executed using the Execute the entire plan toolbar option, the plan execution can retry a timed out step for configurable number of times before it sets the status of the switch step to Failed.
Configuring the Number of Retries for a Timed Out Step (Administration Users)
To allow the plan to retry the actions when they time out, configure the rule DMS Switching Step Fail Retries and Wait Time in the Configuration Assistant Event Management Rules tab.
Note: The rule may be searched for or you may expand DMS Application Rules and then SCADA Configuration Rules.
Add an instance of this rule for DERMS plans. Configure the following:
• rule_value_2: Enter the DERMS sheet class (found in the SWMAN_SHEET_CLS table).
• rule_value_integer_1: Enter the maximum number of retries to perform before setting the step as Failed.
• rule_value_integer_2: Enter the time to wait before retrying the action.
See Using the Event Management Rules Tab for more information on configuring rules.
Viewing the DERMS Optimization Report
Right-click a DERMS event row in the Work Agenda and select Optimization Report. The Optimization Report tab will open in the Event Details window, displaying the affected feeder and the recommended solution.
DERMS Optimization Report Menus and Buttons
File Menu
Menu Option | Description | Toolbar Icon |
|---|---|---|
Print... | Displays the Print Preview window to allow you to print the Recommendation Plan. |
Actions Menu
Option | Description | Toolbar Icon |
|---|---|---|
Generate Switch Plan | Used to convert the recommendations into an actual Optimization plan for execution. This is only necessary in Manual mode. |
Button
Understanding the Summary Pane
The Summary pane shows details for the plan and represents high level details for the DERMS optimization area. A drop‑down selector, Solution Time, allows a user to select each interval within the forecast time horizon. For example, if the DERMS analysis ran for 24 hours with one hour granularity, 24 different options, one for each hour would be available. When the drop‑down selector is changed all the information within the plan will be related to that particular solution and plan recommendation. Before a plan is executed only the Before and After (Estimate) details will be populated. Once a plan has been executed and the power flow resolved, the After (Actual) will be populated. By showing both the estimate and the actual, you can compare the results to determine if any adjustments need to be made to the underlying DMS data (for example, inaccurate load profiles creating incorrect estimates).
Summary Information
• Min Volt (%): The minimum service voltage in the DERMS optimization area.
• Avg Volt (%): The average service voltage in the DERMS optimization area.
• Max Volt (%): The maximum service voltage in the DERMS optimization area.
• Loading: The total loading in the affected area showing both real and reactive power.
• DER Gen: The total DER output in the DERMS optimization area for real and reactive power.
• Losses (kW): The total losses in the optimization area.
• Power Factor: The overall power factor for the DERMS optimization area.
Note: Power factor will be negative for leading and positive for lagging.
• Violations: The total number of violations in the DERMS optimization area.
• Warnings: The total number of warnings in the DERMS optimization area.
DERMS Optimization Messages
The Optimization Messages section displays pertinent information related to an DERMS optimization event. This section is displayed in a tabular format with configurable and translatable messages. The messages contain error information as well as general information such as timing to execute a plan, to create the plan, to update a plan, and so forth. This dialog box also has a related context menu that lets you navigate to devices mentioned in the messages. One key message that will always be displayed in the messages section is the reason the DERM analysis was run. For example, it will state it was run due to network changes or due to the normally scheduled timer responsible for creating DERMS plans daily.
Recommendation Plan
This section of the report gives details of the plan, including Substation, Feeder, and Device level information. The device level information shows the before and after position settings as determined by the DERMS optimization. Select a device row, right-click, and select View... to launch the Viewer with the device in focus. Note that the steps shown in the recommendation plan are for the interval that has been selected in the Solution Time drop down selector.
Plan Details
The Plan Details window has a Feeder pane that shows feeders involved in the analysis and a tabbed pane that displays information about a selected feeder.
Feeders Pane
The Feeders pane lists all of the feeders affected by the analysis and provides details about loading and violations before and after the optimization plan is executed. Before a plan is executed only the Before and After (Estimate) will be populated. Once the optimization plan has been executed and the power flow resolved, the After (Actual) values will populate. Note that the feeders displayed within this pane drive the selection for the tabbed pane.
Tabbed Pane
When you select a feeder from the Feeders list, the following tabs are displayed:
• Violations: shows any violations associated with the selected feeder. To focus the Viewer on the device associated with the violation, select a violation in the list and click the View... button.
Note: The View... button is enabled whenever a violation node is selected.
• Voltage Profile Graph: this graph shows the voltage profile along the feeder representing voltage at each service point for before (displayed gray) and after (displayed blue) plan execution. This shows you the graphical voltage drop that occurs on the feeder and also shows you how the voltage profile will be raised or lowered at different sections as a result of implementing the plan.
• Voltage Distribution Graph: this graph displays the voltage distribution in the form of a frequency plot on the affected feeders. The before results are displayed in gray and after results in blue.
• SCADA Measurements: displays before and after measurements for SCADA telemetered devices within the optimization area. If the plan has not been executed, only the before values will display; once a plan is executed the after values will be populated. This table allow you to view loading before and after the optimization. If you select a row in the SCADA Measurements table, the right-click context menu provides options to open the SCADA Summary (SCADA Summary...) or view the selected device in the Viewer (View...).
• Loads Summary for the selected feeder. To see the table, select the tab Loads Summary in the tabbed pane. This will show a tabular view of all the load points on the selected feeder. From this information a user can see before and after voltages and loading per phase.