Fault Location, Isolation, and Service Restoration Timeline
These figures show the sequence of events in a Fault Location, Isolation, and Service Restoration scenario. The following figure shows the various scenarios in the momentary processing.
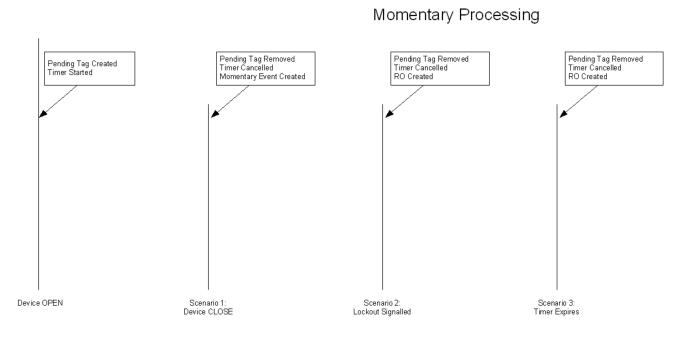
Note: RO is created only if customer supply nodes are de-energized as a result of the operation.
Once an RO is created, the Fault Location, Isolation, and Service Restoration processing sequence shown in the following figure is initiated.

The control sequence (starting at around 25 seconds) is only performed in automatic mode. In manual mode an operator must initiate the control sequence.
Timings in the above diagram are only indicative. Actual values will depend on the complexity of the solution required and the responsiveness of the isolate/restore controls sent to SCADA. The following timings are deterministic:
• The delay allowed for demand scans. This is configurable and defaults to 10 seconds
• The maximum time allowed for the solution in automatic mode. This is configurable and defaults to 15 seconds. If the solution takes longer to solve than this time, Fault Location, Isolation, and Service Restoration will not automatically execute the control sequence. The option for an operator to manually initiate the control sequence is preserved though.
• Maximum time allowed for automatic operations after the lockout is: Demand scan delay + 15 seconds (25 seconds in the default configuration).
• Wait times for Auto-Reclose operations. These are 20 seconds.