Data Source and Data Quality
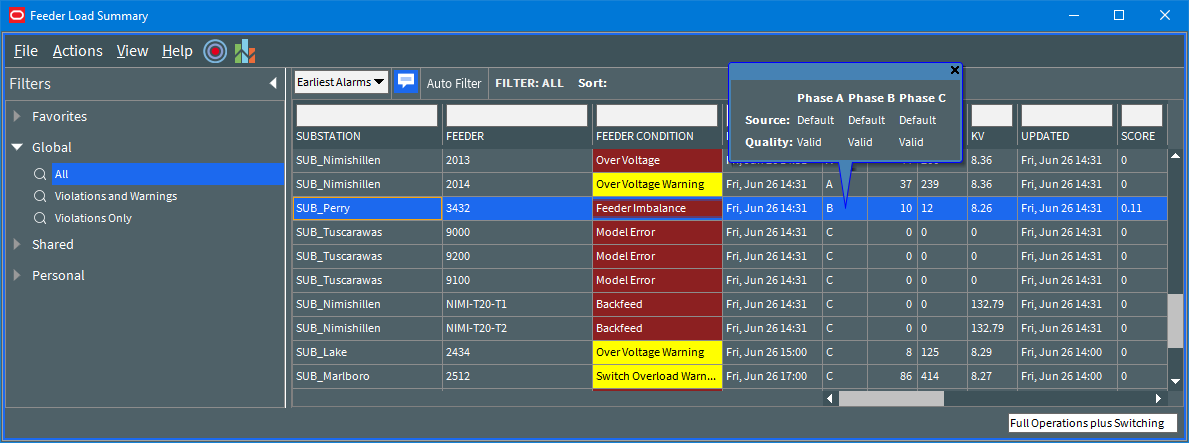
Possible sources of data for a feeder head are Default, SCADA, or Manual Entry. SCADA is considered to be the normal source; the other two are considered abnormal.
Possible values of data quality are:
• Valid: data is valid.
• Suspect: there are inconsistencies in the data that the system cannot reconcile, which indicates a possible misconfiguration of SCADA or model data.
• Invalid: the SCADA system has reported a measurement as being unusable.
• Load: indicates a measurement is suspect because the system is unable to scale the loads to match it.
• Profile: indicates a potential mismatch between modeled load profile Power Factor and the value determined from SCADA. Incorrectly modeled shunt devices can also trigger this value.
• Filtered: Value from SCADA was not used to scale Power Flow solution.
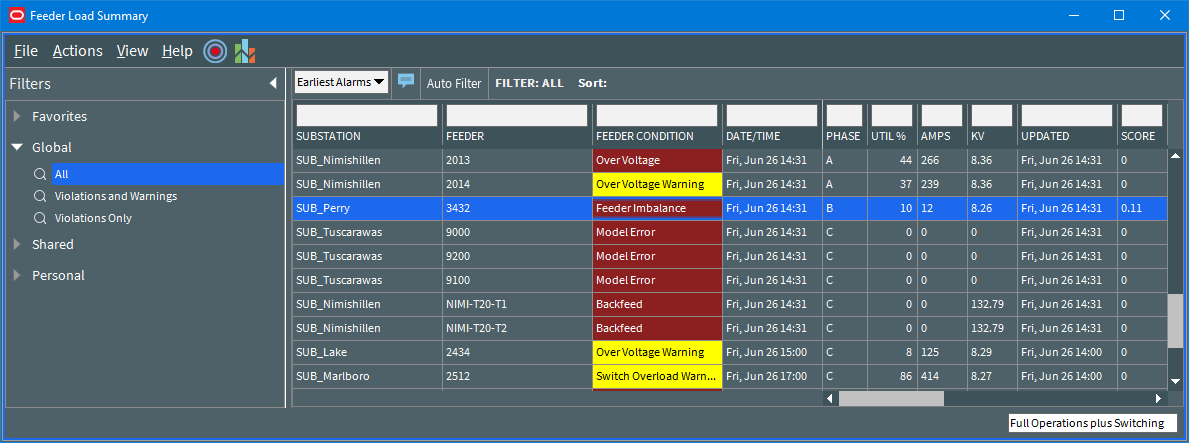
A yellow or red background for a Feeder Condition in Feeder Load Summary or Feeder Load Overview indicates that the feeder head data source and/or quality is abnormal.

Data source, quality, and alarm counts are not included in Feeder Load Management tables by default. To see this additional information, enable balloon details and select a table row.

Identifying Devices with SCADA Suspect and SCADA Inconclusive Results
After finding that a power flow will not solve due to a suspect SCADA data, you can use FLM to identify the devices that are returning bad data. You may identify the problem by viewing a device in the Viewer and seeing that the Power Flow will not solve or by seeing a Suspect SCADA feeder condition in the Feeder Load Summary.
1. Once you have opened FLM, notice the row with the Suspect SCADA condition.
2. Select the row and click the Feeder Details button ().
3. Select a row with Suspect data and click the Viewer Focus button ().
Using the DMS Summary
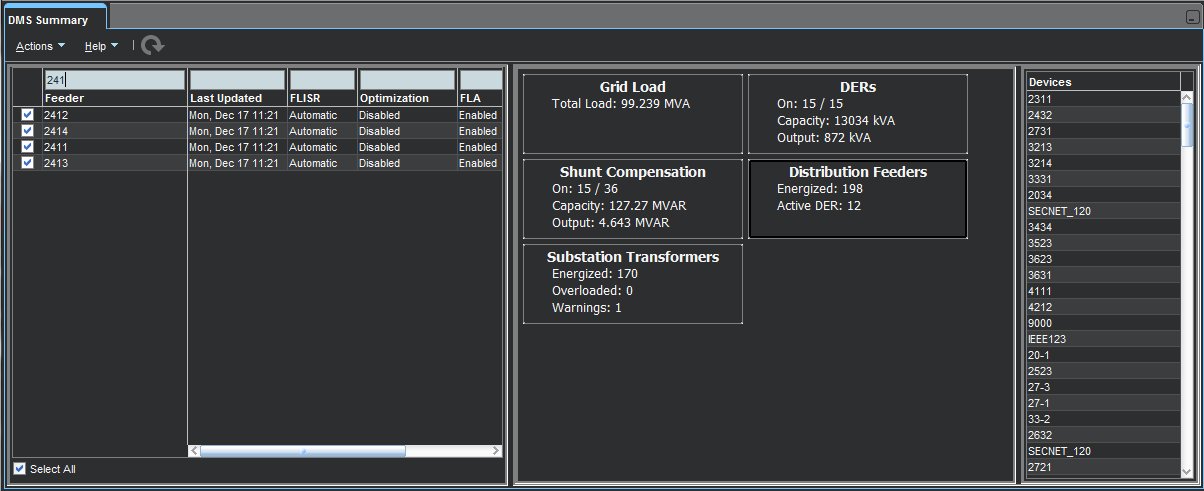
The DMS Summary displays the summary of the distribution system for FLM-enabled feeders. 

The DMS Summary is comprised of three panes:
1. The Feeder pane (left) displays a table with the FLM-enabled feeders in the subscribed zone. The filter box allows you to filter the list to quickly find a feeder of interest. The check box allows you to select or deselect all feeders. The table provides the following columns:
• Feeder
• Last Updated
• PF Mode (hidden by default)
• FLISR
• FLM (hidden by default)
• Optimization
• FLA
• Optimization Objective
• Protection Scheme
• Protection Scheme Mode
• Feeder Type (hidden by default)
• PF History (hidden by default)
Note: See “Understanding Column Display Options” for information on unhiding and hiding table columns.
2. The middle pane displays the status of Grid Load, DERs, Distribution Feeders, Shunt Compensation, and Substation Transformers.
3. The Devices pane (right) displays a list of devices providing data for the block selected in the middle pane.
When there is an update available from FLM, the Refresh button () will be enabled; click the Refresh button to update the DMS Summary data.
If you select a device listed in either the left pane or right pane and right-click, you can select View... to focus the device in the Viewer.