Working with the DERMS Strategies/Event Details Tool
DERMS Strategy/Event Details Header
The strategy or event Details Header section displays general details about the strategy or event. It includes the following fields:
• The ID field displays the unique ID number generated for the strategy or event
• The Name field displays the name of the strategy or event. This field is required
• The Description field displays the description of the strategy or event.
• The Control Zone field displays the selected zone for this strategy or event. This field is required.
• The Programs field displays the programs used in this strategy or event. When the Method is Automatic, this field controls which programs can be used when generating stages.
• The Resources field displays the device groups used in the strategy or event. When the Method is Automatic, this field controls which programs can be used when generating stages
• The Type column displays whether the row is an Emergency, Economic, or other configured category.
• The Objective column displays whether this is intended to be a Manual strategy or event, Max Demand Threshold, Load Reduction, or Maximum Reduction event.
• The Current State field displays the state of the event (New, Submitted, Denied, Approved, Scheduled, In Progress, Completed, or Canceled) or strategy (Active, Archived.)
• The Parent Strategy and Parent Name fields display details about the strategy that created this event. These are not visible when viewing a strategy.
• The Start Time field displays the start time of the first stage.
• The End Time field displays the end time of the last stage.
• The Control Level field displays the reduction level to use in the stages.
• The kVA Summation check‑box controls whether you are viewing the kVA Summation forecast (as opposed to the traditional Power Flow solution).
• The Override Rules check‑box controls whether you are overriding rules to include additional devices in the strategy or event.
DERMS Strategy/Event Details Stages Tab
The Stages tab displays the list of stages for a selected strategy or event.
Stages List Columns
• The Stage # column displays the number of the stage, in chronological order.
• The Stage ID column displays the generated number for the stage.
• The Start Time column displays the start time of the stage.
• The End Time column displays the end time of the stage.
• The Conflict column displays whether any devices in this stage conflict with other events.
• The Alerts column displays whether the stage has any associated active alerts or warnings.
• The State column displays the state of the stage (Planned, In Progress, Completed).
• The MW Before column displays the projected load for all the zones of that stage, for each hour of the duration. Multiple hours are separated by the "|" symbol.
• The MW After column displays the projected resulting load if the stage were to execute. Multiple hours are separated by the "|" symbol.
• The Reduction column displays the projected MW reduction if the stage were to execute. Multiple hours are separated by the "|" symbol.
• The Online Reduction column displays the projected MW reduction if the stage were to execute considering only the DR units that were most recently reported online. Multiple hours are separated by the "|" symbol.
• The Stage Type column displays whether the stage was created by choosing by Feeder or by Devices.
• The Program column displays the program used in this stage.
• The Resources column displays the resource groups chosen for this stage.
• The Control Level column displays the Control Level chosen for this stage.
• The Duration column displays the length of the stage.
• The Precool column displays the projected precool load added before the stage starts.
• The Snapback column displays the projected snapback load added after the stage ends.
• The Total Units column displays the total number of DR units available for use in the stage.
• The Included Units column displays the number of DR units used in the stage.
• The Online Units column displays the number of DR units, from the Included Units, that were most recently reported online.
Actions
Actions Menu
Menu Option | Description |
|---|---|
 Lock/Unlock Lock/Unlock | Lock or unlock toggle. |
 Add Stage Add Stage | Opens the Add/Edit Stage dialog box. |
 Edit Stage Edit Stage | Opens the Add/Edit Stage dialog box. |
Deletes the selected stage. | |
 Show Conflicts Show Conflicts | Displays a dialog box listing conflicting events. |
Show DERs | Opens a dialog box listing the DERs used in the selected stage. |
 Alert History Alert History | View the history of all alerts for the selected event. |
 Generate Stages Generate Stages | Generates the stages necessary to meet the objective. |
 Save As Strategy Save As Strategy | Saves the event as a strategy. |
 Refresh Refresh | Refreshes the table. |
Stage Context Menu Actions
• Click the Edit Stage button to edit the selected stage. This displays the Add/Edit Stage dialog box.
• Click the Delete Stage button to delete the selected stage.
• Click the Show Conflicts button to display a dialog box listing the conflicting events.
• Click the Alert History button to view a history of all alerts for the stage.
• Click the Retry Stage Alerts button to retry all alerts for the stage
• Click the Archive Stage Alerts button to archive all alerts for the stage
• Click the Show DERs button display a dialog box listing the DERs used in this stage.
The Add/Edit Stage Dialog Box
The Add/Edit Stage dialog box allows you to change the start or end time of the stage, and to choose which zones to use in the stage. The Summary table updates as you change your selections.

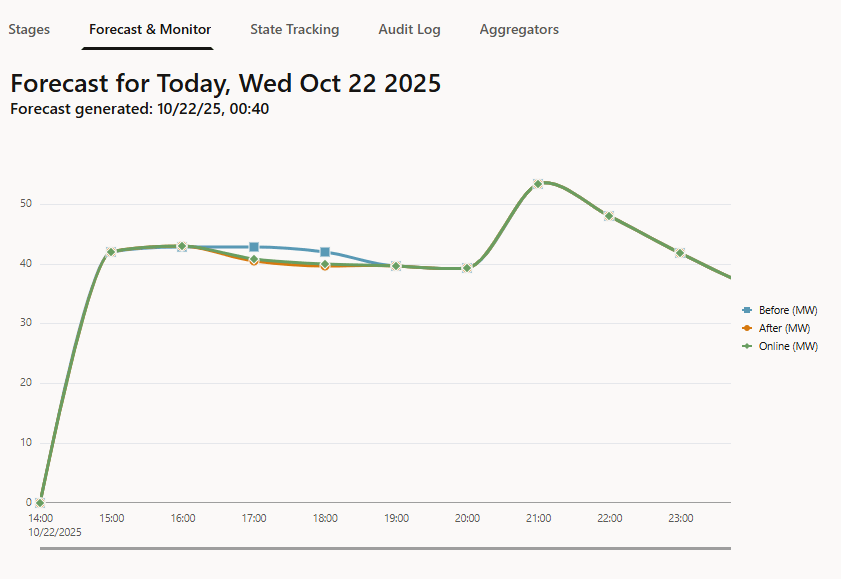
DERMS Strategy/Event Details Forecast & Monitor Tab
The Forecast & Monitor tab displays a graphical representation of the strategy or event. This includes Before, After, and Online lines. And once an event is finished, it also displays an Actual line. By default, this graph starts at 12:00 AM tomorrow (in the user’s time zone), but will start at the next hour if Execute This Event Today is checked.
DERMS Strategy/Event Details Audit Log Tab
The Audit Log tab displays audit log details about the strategy or event, including state changes, notifications to external systems, and stage edits.
DERMS Strategy/Event Details Aggregators Tab
The Aggregators tab displays status information for the DR units involved in the event summarized by head end system.
Aggregators List Columns
• The Head End System column displays the head end system identifier.
• The Description column displays the head end system description.
• The Date Updated column displays the timestamp of the latest DR unit status information.
• The Total Units column displays the total number of DR units available for use in the event.
• The Included Units column displays the number of DR units used in the event.
• The # Online column displays the number of Included Units that are online per latest DR unit status information.
• The # Offline column displays the number of Included Units that are offline per latest DR unit status information.
• The # Unknown column displays the number of Included Units with unknown status per DR unit device status information.