Working with the DERMS Alerts
The DERMS Alerts tool displays all active alerts and warnings in the system.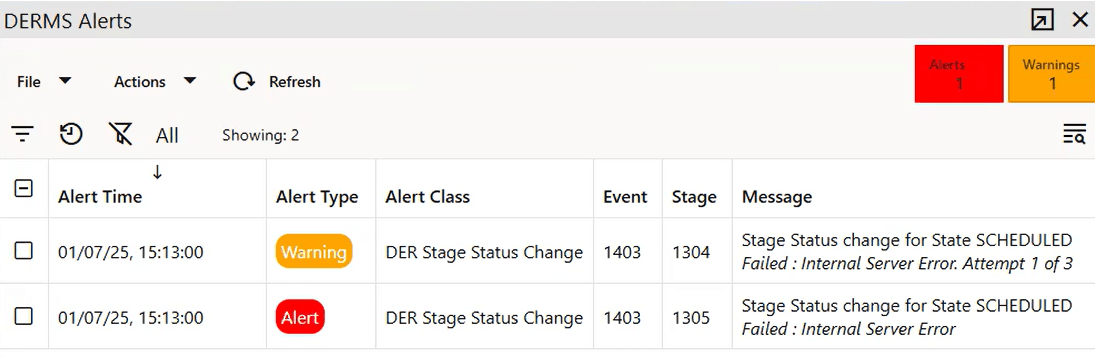
Understanding the DERMS Alerts Tab
DERMS Alert Columns
• The Alert Time column shows when the alert was generated.
• The Alert Type column: Indicates the type of alert (Alert or Warning).
• The Alert Class column shows the classification of the alert, such as the type of message associated with the alert.
• The Event column displays the Event ID associated with the alert.
• The Stage column displays the Event Stage ID associated with the alert.
• The Message column provides detailed information about the alert, including the number of retries or the final state.
DERMS Alert Actions
• Edit Event: Opens the Event Details for the event associated with the selected alert.
• Archive: Acknowledges the alert and removes it from the list of active alerts.
• Retry: Resends a failed message associated with the alert.
Understanding Retries
When the system fails to send a message to an external system, and that message is configured to retry upon failure, the system will resend the message after a configurable delay (as defined by the ALERT_RETRY_PERIOD parameter). The system will attempt to resend the message multiple times, based on the MSG_FEP_MAX_ATTEMPTS parameter.
Operators can pre-empt the system retry by selecting the alert and choosing the Retry action. Once the maximum number of attempts is reached, the system will stop attempting to resend the message. At that point, if the alert is still active in the DERMS Alerts tool, the operator may select the alert in its final state and request that the message be resent, which will start a new cycle of retry attempts.
Whether an alert is configured as an Alert or a Warning, while retries remain, it will always be generated as a Warning. Once all retry attempts have failed, a final alert is generated according to its configured Alert Type (Alert or Warning).
Archiving the final alert removes it from the DERMS Alerts tool and prevents further retries. However, if the alert is archived while retries are available, the system will continue resending the message until all attempts are exhausted.
Alerts and Warnings Summary
The Alerts and Warnings Summary appears on the right side of the toolbar and displays a count of all active alerts and warnings. It is only visible if active alerts exist, and the Warning Summary is visible only when there are active warnings.
Working with the DERMS Alert History Tool
The Alert History tool provides a historical view of both active and archived alerts and warnings.
Alert History Columns
• The Tag column contains a unique internal identifier; all alerts related to the same message instance share the same tag. Right-click to auto-filter alerts by tag.
• The Alert Time column shows the time the alert was generated.
• The Alert Type column shows the type of alert (Alert, Warning, or Info).
• The Alert Class column shows the classification of the alert, such as the type of message associated with the alert.
• The Event column shows the Event ID associated with the alert.
• The Stage column shows Event Stage ID associated with the alert.
• The Message column contains detailed information about the alert, including the number of retries or the final alert state.
• The Retried By column shows who retried the alert (system or operator).
• The Date Retried column shows the time the alert was retried.
• The Removed By column shows who archived the alert (system or operator).
• The Date Removed column contains the time the alert was archived.
Alert History Filters
• The Start Time field allows a historic start date range to be applied to the history.
• The End Time field allows a historic end date range to be applied to the history.
• The Event field allows all alerts associated with an Event to be fetched.
• The Stage field allows all alerts associated with an Event Stage to be fetched.
Alert History Actions
• The Fetch action will perform a historic query based on the Alert History Filters.
• The Last Hour action will update the date range filters to fetch data for the last hour and then perform a historic query.
Alerting when Actuals Deviate from Forecasts
The system generates an alert if the actual load value for an in progress event significantly exceeds the forecast in the event. There are two parameters used to control this behavior:
• ACTUALS_EVENT_THRESHOLD: This parameter contains the percentage value of the 'After' forecast that the real time actual load must exceed in order to require the system to generate an alert.
• ACTUALS_FLM_AVAILABLE_MINS: The real time load is obtained through power flow studies generated by Feeder Load Management. This happens cyclically (normally once every 15 minutes) however it may take several minutes for FLM to complete the studies and report the results. This parameter indicates the maximum amount of time that the system will wait for FLM to complete the studies for all feeders so that it can use the data to compare with the After forecasts. If the FLM data is captured before this time period the system will use the data as soon as possible. If this time period elapses and all the studies have not been completed the system will use the data it has (old and new), but any alert generated will indicate that the FLM data was not up to date.
If an event exceeds the forecast value by the percentage, then an Actual Load Threshold alert will be generated. The alert will not be re-generated while the event stays in this state. The behavior of the alert can be configured in the Configuration Tool's Alerts tab for the Actual Load Threshold entry.
The Actual data series in the events Forecast & Monitoring tab will uses a different point color and marker to display any actual point that exceeds the after forecast by the threshold value, thus differentiating it from values within the expected range.