Working with the DERMS Strategies/Event Details Tool
DERMS Strategy/Event Details Header
The strategy or event Details Header section displays general details about the strategy or event. It includes the following fields:
• The ID field displays the unique ID number generated for the strategy or event
• The Name field displays the name of the strategy or event. This field is required
• The Description field displays the description of the strategy or event.
• The Control Zone field displays the selected zone for this strategy or event. This field is required.
• The Programs field displays the programs used in this strategy or event. When the Method is Automatic, this field controls which programs can be used when generating stages.
• The Resources field displays the device groups used in the strategy or event. When the Method is Automatic, this field controls which programs can be used when generating stages
• The Type column displays whether the row is an Emergency, Economic, or other configured category.
• The Objective column displays whether this is intended to be a Manual strategy or event, Avoided Capacity, Load Reduction, or Maximum Reduction event.
• The Current State field displays the state of the event (New, Submitted, Denied, Approved, Scheduled, In Progress, Completed, or Canceled) or strategy (Active, Archived.)
• The Parent Strategy and Parent Name fields display details about the strategy that created this event. These are not visible when viewing a strategy.
• The Start Time field displays the start time of the first stage.
• The End Time field displays the end time of the last stage.
• The Control Level field displays the reduction level to use in the stages.
• The kVA Summation check box controls whether you are viewing the kVA Summation forecast (as opposed to the traditional Power Flow solution).
• The Override Rules check box controls whether you are overriding rules to include additional devices in the strategy or event.
DERMS Strategy/Event Details Stages Tab
The Stages tab displays the list of stages for this strategy or event.
Stages List Columns
• The Stage # column displays the number of the stage, in chronological order.
• The Stage ID column displays the generated number for the stage.
• The Start Time column displays the start time of the stage.
• The End Time column displays the end time of the stage.
• The State column displays the state of the stage (Planned, In Progress, Completed).
• The MW Before column displays the projected load for all the zones of that stage, for each hour of the duration. Multiple hours are separated by the "|" symbol.
• The MW After column displays the projected resulting load if the stage were to execute. Multiple hours are separated by the "|" symbol.
• The Reduction column displays the projected MW reduction if the stage were to execute. Multiple hours are separated by the "|" symbol.
• The Temperature Offset column displays the offset temperature for that stage.
• The Precool column displays the projected precool load added before the stage starts.
• The Snapback column displays the projected snapback load added after the stage ends.
• The Included Units column displays the number of DR units used in the stage.
• The Available Units column displays the total number of DR units available for use in the stage.
• The Conflict column displays whether any devices in this stage conflict with other events.
Stages List Actions
• Click the Save button to save the strategy or event.
• Click the Add Stage… button to add a new stage. This displays the Add/Edit Stage dialog box.
• Click the Edit Stage… button to edit the selected stage. This displays the Add/Edit Stage dialog box.
• Click the Delete Stage button to delete the selected stage.
• Click the Show Conflicts button to display a dialog listing the conflicting events.
• Click the Show DERs button display a dialog listing the DERs used in this stage.
• Click the Save As Strategy button on an event to save it as a strategy.
The Add/Edit Stage Dialog Box
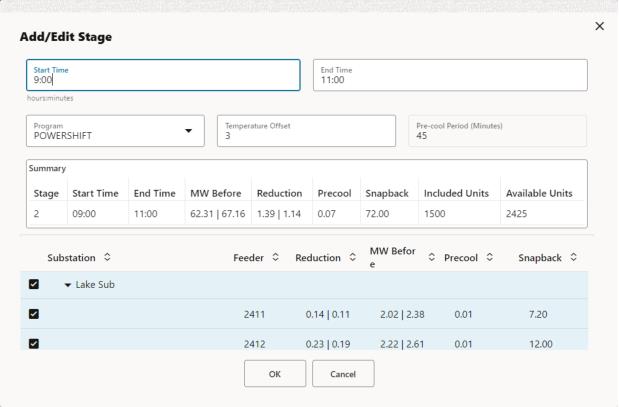
• The Add/Edit Stage dialog box allows you to change the start or end time of the stage, and to choose which zones to use in the stage.
• The Summary table updates as you change your selections.
DERMS Strategy/Event Details Forecast & Monitor Tab
The Forecast & Monitor tab displays a graphical representation of the strategy or event. This includes Before and After lines. And once an event is finished, it also displays an Actual line. By default, this graph starts at 12:00 AM tomorrow (in the user’s time zone), but will start at the next hour if Execute This Event Today is checked.
DERMS Strategy/Event Details Audit Log Tab
The Audit Log tab displays audit log details about the strategy or event, including state changes, notifications to external systems, and stage edits.