Oracle WebLogic Console Operations
Note: Parts of this section do not apply to implementations using the embedded mode. Refer to individual sections for guidance.
When using the native mode of Oracle WebLogic to manage the product, the Oracle WebLogic administration console can be used to perform common operations. This section outlines the common operations that can be used from the console. Refer to the Administration documentation supplied with Oracle WebLogic for further advice.
Starting and Stopping from Console
Note: This facility should only be used for customers using native mode. Customers using embedded mode should use the spl utility.
As the product is using the native mode and native utilities provided by Oracle WebLogic it is possible to manage the product start and stop from the console. To perform this function, the user must do the following:
• Log in to the console designated to administrate the environment using an appropriate administration account. The default installation account is system.
• Select the Deployments section of the Domain Structure. This will list the deployments to the domain.
• Select the appropriate deployments to start or stop.
• Use the Start or Stop function to perform the start or stop operation, respectively.
For example: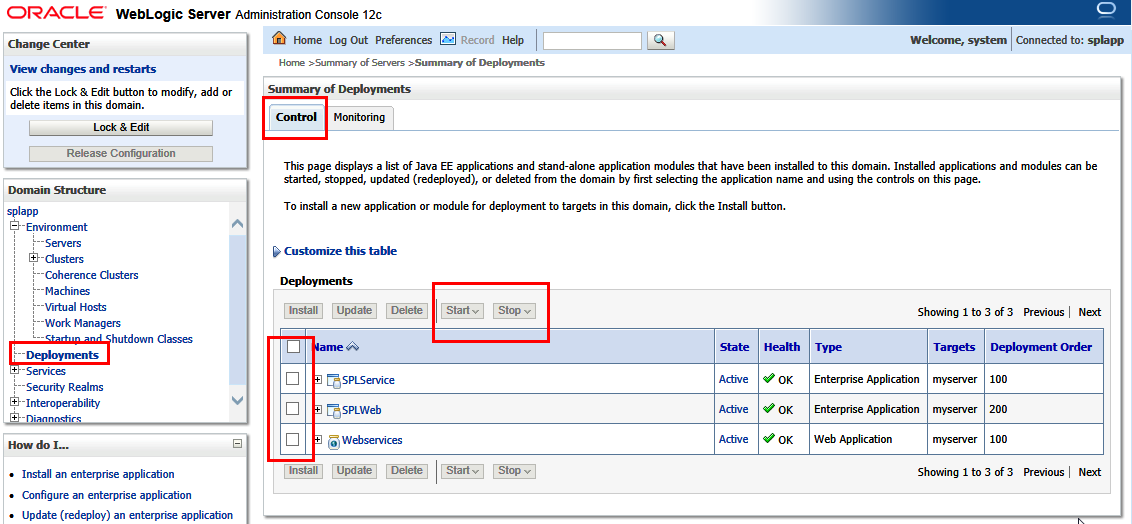
For example:
Figure 40 – Default Oracle WebLogic Deployments
While it is possible to start or stop individually components it is recommended that all components be started at once to avoid availability issues. If individual components are started or stopped use the following guidelines to minimize issues:
• Be aware of the architecture when stopping components. When starting the product, components lower in the architecture must be started first. When stopping the product, components higher in the architecture should be stopped first. Use the table below as a guide:
Deployment | Role |
|---|---|
root | Web Application Server |
SPLService | Business Application Server |
Webservices | Application Integration |
oHelp | Online Help |
AppViewer | Data Dictionary |
• Stopping non-essential runtime components such as Online Help and AppViewer may result in HTTP 404 error when users select these functions unless they are sourced from other servers.
Monitoring Web Applications Using the Console
Note: This facility is available regardless of mode (embedded or native) used on the environment.
The Oracle WebLogic administration console can be used to monitor the state and performance of the individual components of the product. This can be achieved using the Monitoring tab of the Deployments option of the Domain Structure section of the Oracle WebLogic administration console.
This allows the following to be monitored:
• Web Applications – Statistics relating to the web applications deployed to the server. The Context Root and Source Information outlines the individual component monitored.
• JMS – If you are using the Message Driven Bean functionality within the product to integrate to the JMS resources in the Oracle WebLogic server then statistics related to this function can be monitored.
• EJBs – The Business Application Server and Message Driven Bean functionalities are expressed as Enterprise Java Beans (EJB) and can be monitored from the console. The EJB SPLServiceBean is the business application server.
• Web Services/Web Service Clients – When using the native Web Service capability, the statistics applicable to individual Web Services can be monitored.
• JDBC – If JDBC data sources are manually configured then statistics relating to these connections can be monitored.
• Workload – By default, Oracle WebLogic allocates simple workload managers for each deployment. These workload managers and any custom constraints can be monitored.
Refer to the Oracle WebLogic documentation for a detailed description of each of the statistics and their relevance.