Web-Based Insights
Depending on the utility's program design and setup, customers may be able to access information about their peak events savings in their web experience in the Energy Efficiency Web Portal or Digital Self Service - Energy Management widgets.
Energy Efficiency Web Portal Rebates
Information about Peak Time Rebates can be displayed in the Energy Use and Energy Costs views of the Energy Efficiency Web Portal Data Browser feature if a customer earns rebates for reducing their energy use during peak events. The display of this rebate information varies depending upon the view that is selected.
Note: The Costs view in the Energy Efficiency Web Portal Data Browser is available only if cost information is available. Otherwise, this entire view of the Data Browser may be hidden. The Costs view only displays data in a bar graph. It will not display data in a line graph.
- In the Year view, no rebate information is displayed.
- In the Bill view, a dollar sign symbol indicates when a customer earned a rebate. When the customer hovers over the dollar sign, the kWh savings, money savings, and temperature information for that rebate is displayed.
- In the Day view, a dollar sign symbol indicates when a customer earned a rebate. When the customer hovers over the dollar sign, the energy savings hours, kWh saved, money saved, and temperature information for that rebate is displayed.
An error message is displayed if the customer is missing data at certain resolutions (by year, by bill, or by day). Estimated reads are marked as such in the Data Browser.
Digital Self Service - Energy Management Rebates
The Peak Time Rebate widget allows customers who are enrolled in Peak Time Rebates to view their historical peak event day rebate and energy saving information in a user-friendly graph.
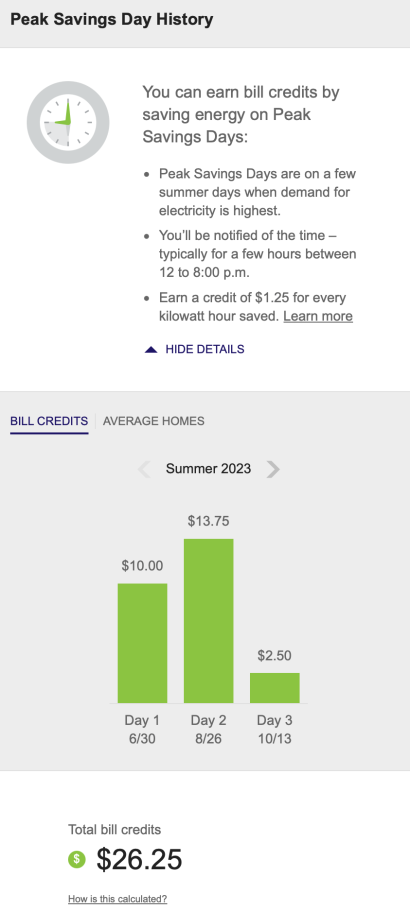
- Bill Credits: This graph displays how much money a customer has earned by saving energy on peak rebates event days.
- Average Homes: This graph displays how much money a customer has saved compared to homes within 100 miles of them and who saved energy on an energy savings day. Average homes data is only available for the money comparison and peak rewards experiences.
- Tool tip: When hovering over the Bill Credits or Average Homes graphs, pertinent information about the day is displayed including date and day of the week, specific event hours and average temperature during that period, how much energy the customer saved compared to their baseline, and the rebate amount is displayed.
- Total Bill Credits: This section calculates the customer’s cumulative rebate amount for the selected season.
See the Energy Management Cloud Service Overview for additional information about the Digital Self Service - Energy Management product requirements and features.