Multi-Service Comparison Module
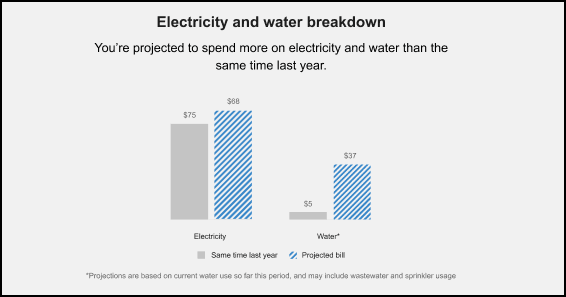
The Multi-Service Comparison module is included in the Email High Bill Alert AMI for customers who have multiple services, such as water and electric. The module includes two bar graphs. Each graph compares projected costs to costs from the same billing period of the previous year. One graph shows electricity and the other shows water. A dollar amount is displayed above each graph bar.
Note:
Data for the water portion of the module can include standard water service, wastewater, and sprinklers.Requirements
Same as listed in Requirements and Limitations. Additionally, this module requires one service point for electricity and one for water.
Limitations
Water can include standard water service, wastewater, and sprinklers. Customers must have standard water service to generate an electricity and water comparison. This comparison is not valid for wastewater-only or sprinkler-only customers.
User Experience
This section describes the common user experience with the module.
Heading: The module heading tells the customer that they are viewing a breakdown of both electricity and water data. By default, the heading reads, "Electricity and water breakdown".
Subheading: The subheading tells the customer whether they are projected to spend more than they did during the same time period last year. The message varies depending on how much more/less they spend this billing period compared to the same period last year. For example, "You're projected to spend more on electricity and water than the same time last year."
Bar Chart: Two graphs are displayed side by side. The graph on the left displays projected electricity costs for the current period compared to the same period last year. The graph on the right displays projected water costs for the current period compared to the same period last year. The dollar values for each are displayed above the bars.
Bar Chart Labels: If a disclaimer is included in the module, an asterisk (*) can be included on one or both of the bar chart labels to direct the customer's attention to the disclaimer statement, and identify which part of the graph the disclaimer is referring to. For example, if the disclaimer discusses only how water projections are calculated, the label under the water graph should read "Water*".
Legend: Below the chart, a legend displays the color and shading used for the projected bill, and for the same time last year.
Disclaimer: Below the legend, a disclaimer statement includes information that explains how the projections are calculated. For example, "*Projections are based on current water use for this period, and may include wastewater and sprinkler usage." This statement should begin with an asterisk to tie it back to the appropriate bar chart label, if needed.

User Experience Variations
Budget Billing
Budget billing customers see a usage experience for this module. The bar chart labels display units rather than dollar amounts. For example, kWh for electricity and gal for water.
Projections Only/No Baselines
If baseline amounts are not available for one or both of the resources in the chart, the subheader statement refers to the comparison between the projected bill amounts of the resources shown in the chart. For example, if the customer is expected to spend the same amount on electricity and water during this period, the statement reads "You're projected to spend the same amount on electricity and water on this upcoming bill." Alternatively, the subheading could read:
- "You're projected to spend more on electricity than water on this upcoming bill."
- "You're projected to spend more on water than electricity on this upcoming bill."
If baselines for both resource types are not available, the module eliminates the previous year bars and the "Same time last year" from the legend. If a baseline is available for one of the resource types, the module displays "N/A" as the label for the resource without a baseline.
Subheading Variations
The subheader changes based on whether a customer spends more or less than they did during the same period last year. The customer must have spent at least 10% more than the previous year to be considered "spending more" during the current bill period. This 10% threshold for the comparison states is not configurable. These subheader variations are possible:
- Customers spends 10% more on both fuel types: "You're projected to spend more on electricity and water than the same time last year."
- Customer spends 10% more on one fuel/resource type, but not the other: "You're projected to spend more on <fuel/resource type> than the same time last year."
- Customer spends less: "You're projected to spend less on electricity and water than the same time last year." Note that this occurs only when the customer's bill forecast exceeds their personal cost threshold, even though they did not spend more.
- Customer spends about the same: "You're projected to spend about the same on electricity and water than the same time last year." Note that this occurs only when the customer's bill forecast exceeds their personal cost threshold, even though they did not spend more.