Day by Day Breakdown
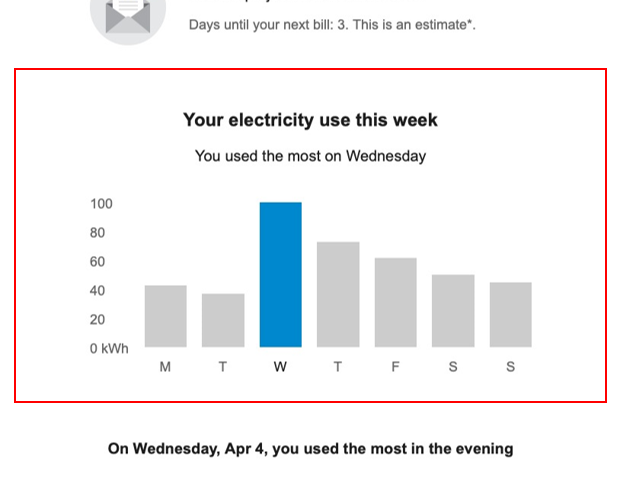
The Day by Day Breakdown shows how much energy the customer spent each day of the previous week. For electricity customers, the bars in the graph represent the total electricity consumed on the corresponding day, and the blue bar represents the day on which the most was used. If a customer's rates are modeled, the cost per day can be displayed below each bar in the graph. Dual fuel versions of the communication include graphs for both electricity and gas use.
Design
The image below is an example of the Day-by-Day Breakdown module for electricity customers.
Configuration Options
For each element listed in the table, indicate the desired configuration in the Input Value column. If you do not provide an input for optional configurations, the default will be used.
|
Configuration Option |
Input Value |
|---|---|
|
Title and Subtitle The title indicates the purpose of the graph. The subtitle indicates the day when energy usage or cost was the highest. Default: Varies by fuel type. See User Experience Variations below for details. |
Optional Choose one of the following: Use the default title and subtitle. Work with your Delivery Team to specify a different title and subtitle. |
|
Bar Colors Bar colors in the graph can match the utility’s color palette. Both the peak bar color and the non-peak bar color can be changed. Default: The colors in the example represent the default colors. |
Required Choose one of the following: Use the default colors. Work with your Delivery Team to specify other colors. |
|
Display Cost Information (not depicted) If a customer's rates are modeled, the cost per day can be displayed below each bar in the graph. Default: Display cost information if it is available. |
Optional Choose one of the following: Use the default (display the cost information if it is available). Hide the cost information. |
User Experience Variations
The user experience varies for customers depending upon their service types, available data, costs, and locale. Note that the following list indicates the primary user experience variations, not all possible variations.
Title
- “Your electricity use this week”
- “Your gas use this week”
Subtitle
- “You used the most on <day>”
Gas-Only
For gas-only customers, the electricity unit “kWh” is replaced by “therms” or "CCFs" (whichever unit of measure is appropriate for the utility), and the word "electricity" is replaced by "gas".
Dual Fuel
Dual fuel customers see two separate Day-by-Day Breakdown modules, one for electricity use and one for gas. The heading above each graph specifies the fuel type.
Rates Modeled
If rates are modeled and the utility has opted to display cost information in this module, then cost information is displayed beneath each bar in the graph to indicate the cost of energy for that day.