Database Monitoring Using Database Actions
Oracle Cloud Infrastructure uses a variety of technologies to monitor the availability and performance of Oracle Cloud Services and the operation of infrastructure and network components. It has been designed using best practices to monitor the processes, data, and access to all cloud technologies within the tenancy.
In addition to comprehensive Oracle Cloud hardware monitoring, Oracle Utilities cloud services are designed based on modern best practices to provide service specific monitoring capabilities extending from the tenancies on which the services are housed to monitoring batch, state, and overall performance.
An important aspect of Software-as-a-Service (SaaS) is that it is monitored by Oracle to ensure that the various services in each environment are available (if not, to resolve the problem and take preventive action), however there are several external tools available to the customers for monitoring as well as for performance and tuning.
Performance Hub Report
The DBMS_PERF.REPORT_PERFHUB package/function can be invoked via Database Actions (provided with Oracle REST Data Services, or ORDS) to generate a composite active performance hub report of the database system for a specified time period.
This self service tool generates a performance hub report of the database which can be used by utility/partner to review and analyze the top SQLs, wait events, CPU usage etc.
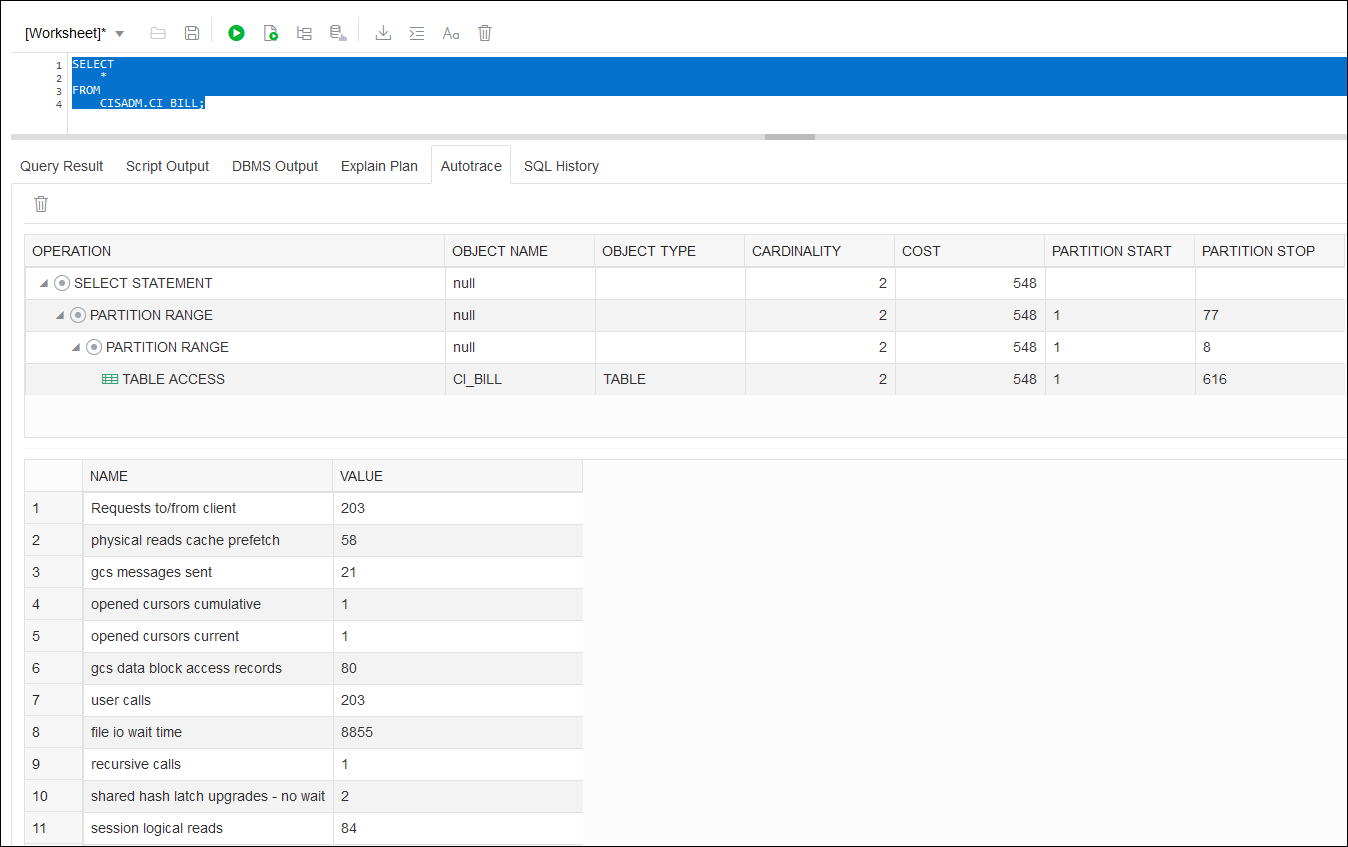
Database Actions (ORDS) displays an explain plan (before execution) which shows the sequence of operations Oracle performs to run the statement. The AutoTrace functionality provides further statistics of the SQL statement (after running the statement) for analysis and tuning.
Use this report when:
• Batch processing is running slow.
• Application portals and zones take a longer than expected time to execute queries.
• Application performance is slow.
This report is also a handy tool for custom development and QA.
Running the Performance Hub Report
Use the following procedure to generate the Performance Hub Report:
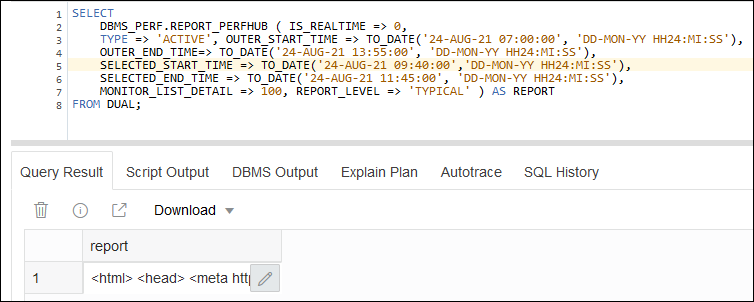
1. Using Database Actions (ORDS), run the following sample SQL statement:
SELECT
DBMS_PERF.REPORT_PERFHUB ( IS_REALTIME => 0,
TYPE => 'ACTIVE', OUTER_START_TIME => TO_DATE('24-AUG-21 07:00:00', 'DD-MON-YY HH24:MI:SS'),
OUTER_END_TIME=> TO_DATE('24-AUG-21 13:55:00', 'DD-MON-YY HH24:MI:SS'),
SELECTED_START_TIME => TO_DATE('24-AUG-21 09:40:00','DD-MON-YY HH24:MI:SS'),
SELECTED_END_TIME => TO_DATE('24-AUG-21 11:45:00', 'DD-MON-YY HH24:MI:SS'),
MONITOR_LIST_DETAIL => 100, REPORT_LEVEL => 'TYPICAL' ) AS REPORT
FROM DUAL;
The following illustrates this SQL statement in Database Actions:

2. Export the output in xml format (select Download in the Query Result section) to the local file system and then change the file extension to .html.
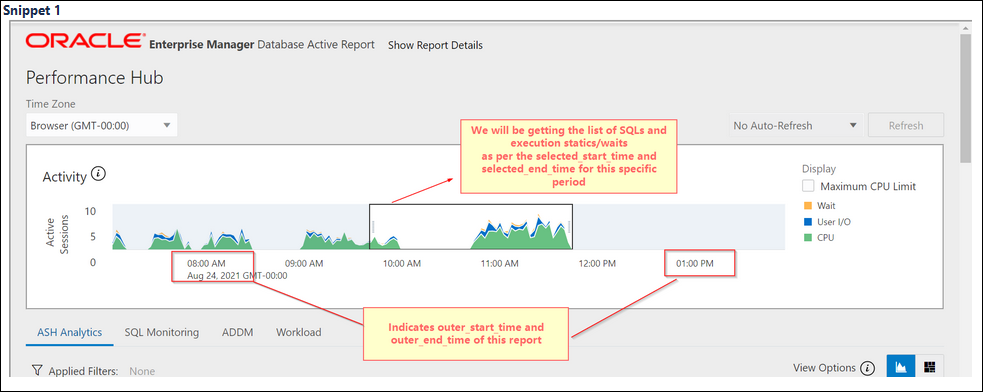
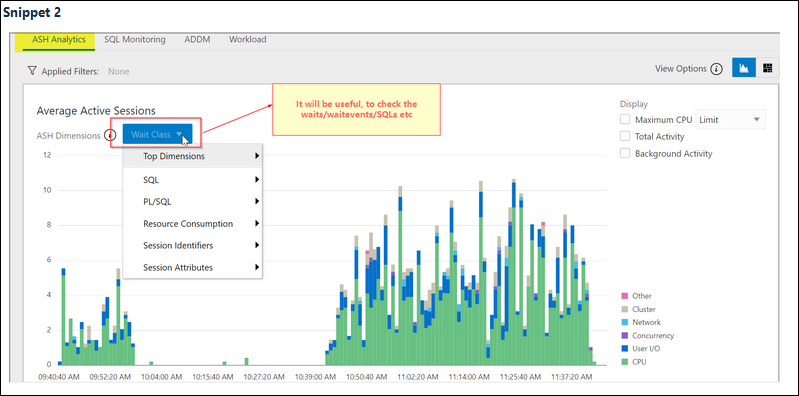
3. Open the file in any browser and review the list of SQLs executed over a period of time, including wait events, CPU usage, and so on.
Performance Hub Report Parameters
The following table lists parameters that can be used when running the Performance Hub Report:
Paremeter | Description |
|---|---|
is_realtime | If 1, then real-time. If NULL (default) or 0, then historical mode. • When real-time data is selected (1), more granular data is presented (because data points are available every minute). • When historical data is selected (0), more detailed data (broken down by different metrics) is presented, but the data points are averaged to specified intervals (typically an hour). |
outer_start_time | Start time of outer period shown in the time selector. If NULL (default): • If is_realtime=0 (historical), then 24 hours before outer_end_time. • If is_realtime=1 (realtime mode), then 1 hour before outer_end_time. |
outer_end_time | End time of outer period shown in the time selector. If NULL (default), then latest AWR snapshot. • If is_realtime=0 (historical), then the latest AWR snapshot • If is_realtime=1 (realtime mode), this is the current time (and any input is ignored) |
selected_start_time | Start time period of selection. If NULL (default) • If is_realtime=0, then 1 hour before selected_end_time • If is_realtime=1, then 5 minutes before selected_end_time |
selected_end_time | End time period of selection. If NULL (default) • If is_realtime=0, then latest AWR snapshot • If is_realtime=1, then current time |
inst_id | Instance ID to for which to retrieve data • If -1, then current instance • If number is specified, then for that instance • If NULL (default), then all instances |
dbid | DBID to query. • If NULL, then current DBID. • If is_realtime=1, then DBID must be the local DBID. |
monitor_list_detail | Top N in SQL monitor list for which to retrieve SQL monitor details. • If NULL (default), then retrieves top 10 • If 0, then retrieves no monitor list details |
workload_sql_detai | Top N in Workload Top SQL list to retrieve monitor details. • If NULL (default), then retrieves top 10 • If 0, then retrieves no monitor list details |
addm_task_detail | Maximum N latest ADDM tasks to retrieve • If NULL (default), retrieves available data but no more than N • If 0, then retrieves no ADDM task details |
report_reference | Must be NULL when used from SQL*Plus. |
report_level | 'typical' will get all tabs in performance hub |
type | Report type: • 'ACTIVE' (default) • 'xml' returns XML |
base_path | URL path for HTML resources since flex HTML requires access to external files. This is only valid for type='ACTIVE' and is typically not used. Default value will retrieve the required files from OTN. |
Performance Hub Report Sample Output


Important Notes
• The Performance Hub Report provides details based on the specified date range parameter. In absence of date range parameter, report will provide data based on the last 15 minutes.
• The target audience of this tool are the local database administrators assigned monitoring and troubleshooting responsibilities.
• The AutoTace functionality follows the ORDS timeout guideline.
• While raising performance related issues via a service request, the customer is required to attach the performance hub report.
• For more details on Performance Hub Report, please visit online documentation (https://docs.oracle.com/en/database/oracle/oracle-database/index.html).
Reviewing and Tuning SQL Statements
SQL statements retrieved using the Performance Hub Report can be reviewed and tuned using Database Actions (ORDS) Explain Plan and AutoTrace functionality. The following screen shots illustration these functions.
Explain Plan:

AutoTrace:
