Dashboard
This is the Home page of the application. The Dashboard page includes two tabs:
Analytics
This tab displays test run analytics with the ability to filter the data using several data points. The tab has three zones:
• The first zone has two visualizations that can be used to visualize the flow run data based on the filters provided at the top of the dashboard:
• Product Family: Filters the visualization data to include flows that belong to the product family selected.
• Product Name: Filters the visualization data based on the selected product name
• Module Name: Filters the visualization data to include flows that belong to the module name selected.
• Flow Name: Filters the visualization data to include flows that start or end with a set of characters.
• Start Date: Filters the visualization data to include flow runs that are after the start date.
• End Date: Filters the visualization data to include flow runs that are before the end date.
The following figure shows the filters applicable for visualizations in the first zone.
After selecting the filter criteria, click Refresh to refresh the visualizations in the first zone. The results are displayed based on the filtered data.
• The first visualization, Flow Run History, provides a view of the cumulative of test flow run results based on the filter criteria. This graph also supports rolling window based visualization, so results can be further filtered across time windows. This visualization shows the count of flow runs divided by their statuses (Stopped, Failed and Passed) subject to the filters.
The following figure shows the rolling window based visualization under the first zone in the dashboard. 
• The second visualization, Flow Usage, helps ascertain the count of flows between flows that were never run, flows that were run but had never passed, and flows that had passed at least once, subject to the filters.
The following figure shows the second visualization related to flow run status.

Run List
The second zone has a run list of flows that are dependent on the filters at the top of the dashboard. The run list shows the list of flow runs based on the values selected against the filters. The generic search provided at the top of the run list can be used to find appropriate results from within the displayed list of values, if required. 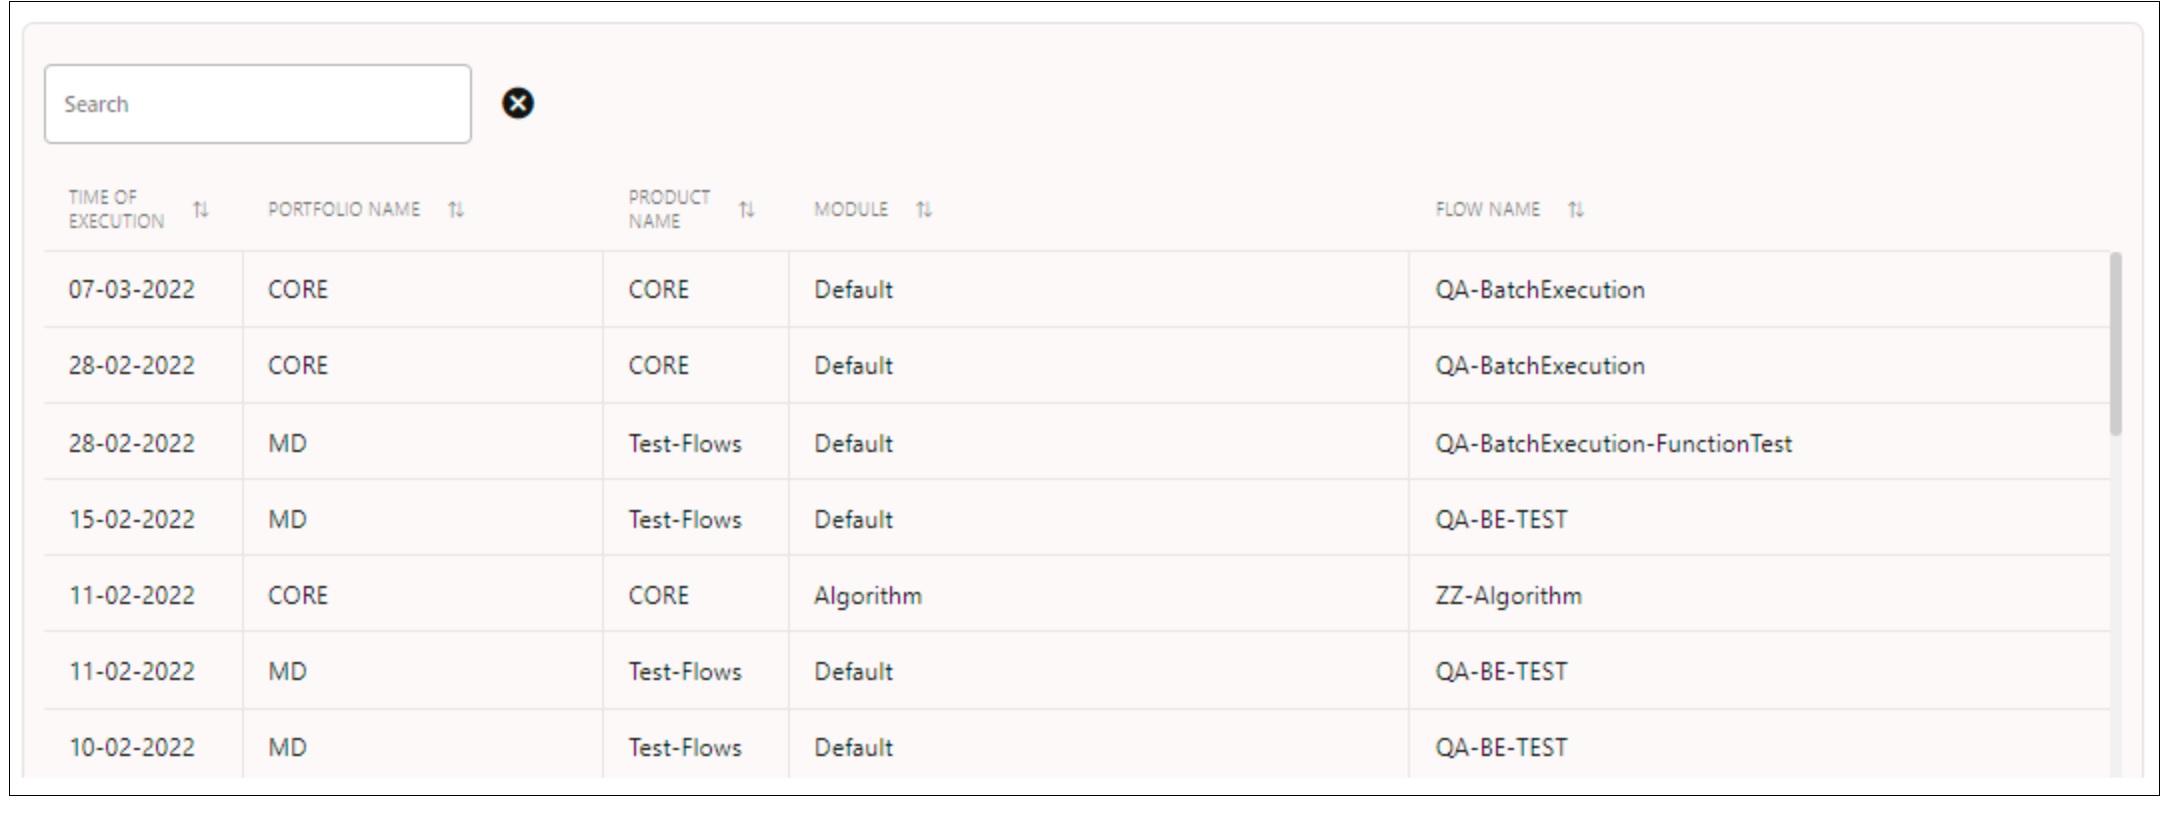
• The zone on the right holds the dashboard that details Flow Status Summary and Component Status Summary. The flow count displays the count of flows in the various states that are applicable to the flows. Similarly, the component count displays the count of components in various states that are applicable to the components.
Note: The filters provided in the dashboard are not applicable to this zone.
Notifications
The Notifications tab displays notifications of interest to the user currently logged in to Oracle Utilities Testing Accelerator.
From the drop-down list, you can select Unread, Read, or All to view the notifications applicable to the current user.
Any event of interest in the application triggers a notification that is sent to one or more users. Events could be either of the following:
• Creating/updating any hierarchy related entity
Example: Release/Portfolio/Product/Module
• Change in lifecycle state of a component/flow
Example: Submitting a component for approval/rejection, etc.
The different types of notifications are as follows:
• FYI Notifications: For informational purpose only and are generated when the following are performed:
• A component/flow for all users is created.
• A release/portfolio/product/module for an administrator is created.
• A user for an administrator is created.
• A flow/component for approval for a developer is submitted.
Click a FYI notification for more information about the event and also mark the notification as 'read'. Once an FYI notification is read, it is removed from the notification area.
• To Do Notifications/FYA Notifications: For a component/flow when submitted for approval by an approver/administrator. They require some action from the user. They are displayed in the Notification area for users with Approver/Administrator role.
A To Do notification displays detailed information about the respective event. It also allows users to take appropriate action as applicable. (example: Reject, Revert to Approve, Approve, or Send to in progress (Flow)). Select the Read column corresponding to the To Do to mark a To Do notification as 'read'.