2.1 VA Transaction Status
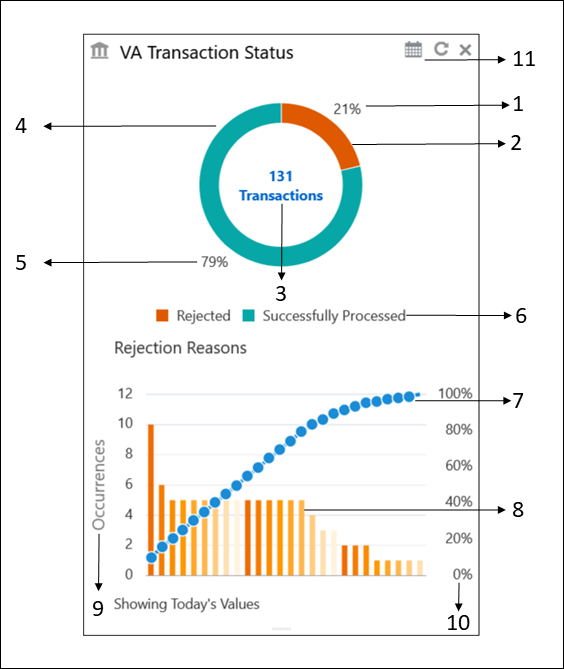
This topic provides information about VA Transaction Status, The user can analyse successful and rejected transactions in a doughnut chart format. Also, user can analyse the reasons for rejections of a transaction in a Pareto Chart format.
From Home, Click Dashboard.
The VA Transaction Status screen displays.
Table 2-1 VA Transaction Status - Component Description
| Component Number | Description |
|---|---|
| 1 | Displays the percentage of the rejected transactions. |
| 2 | Indicates the proportion of the rejected transactions. Hover to view the number of rejected transactions. |
| 3 | Displays the total number of executed transactions. |
| 4 | Indicates the proportion of the successfully processed transactions. Hover to view the number of successfully processed records. |
| 5 | Displays the percentage of the successfully processed transactions. |
| 6 | Displays the legends.
The available
legends of the transaction are:
|
| 7 | Indicates the cumulative percentage of rejections in an incremental order. Hover to view the reason and the cumulative percentage. |
| 8 | Indicates the rejection reasons of the records. Hover to view the reason and the number of occurrences. |
| 9 | Displays the measurement of the occurrences in the left y-axis. |
| 10 | Displays the percentage of the cumulative in the right y-axis. |
| 11 | By default, the data is displayed for Today’s
transactions. Select the calender to choose a different period.
The
available options are:
|
Parent topic: Dashboard
