2 Monitor ELK

This topic describes the procedure for installing and configuring the ELK.

The ELK Stack is a collection of the following open-source products:
  • Elasticsearch: It is an open-source, full-text search, and analysis engine based on the Apache Lucene search engine.
  • Logstash: Logstash is a log aggregator that collects data from various input sources, executes different transitions and enhancements, and then transports the data to various supported output destinations.
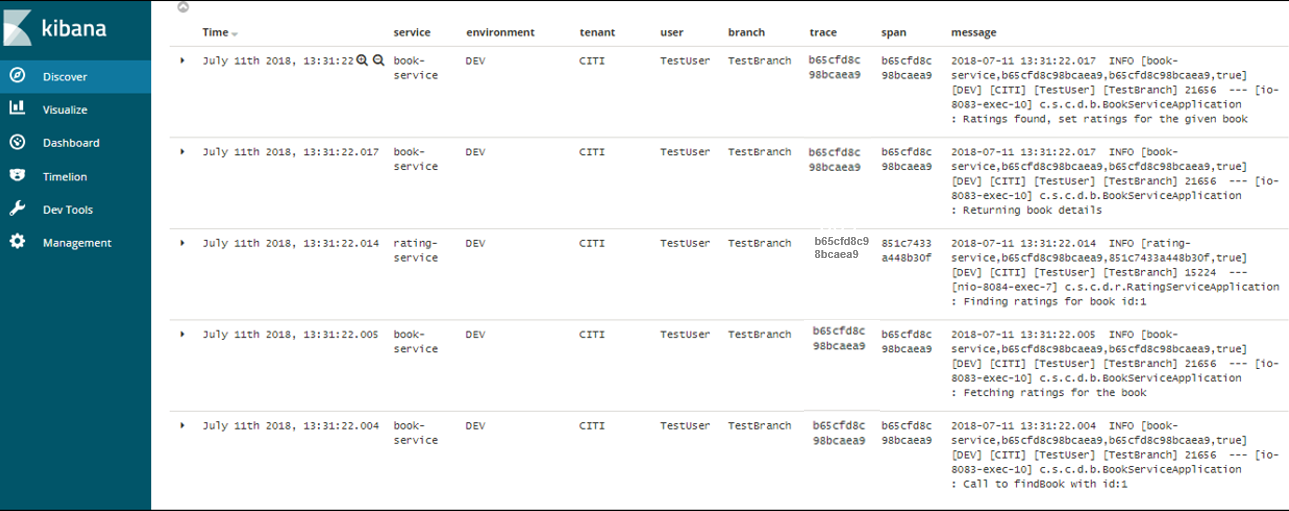
  • Kibana: Kibana is a visualization layer that works on top of Elasticsearch, providing users with the ability to analyze and visualize the data.

These components together are most commonly used for monitoring, troubleshooting, and securing IT environments. Logstash takes care of data collection and processing, Elasticsearch indexes and stores the data, and Kibana provides a user interface for querying the data and visualizing it.

2.1 Architecture

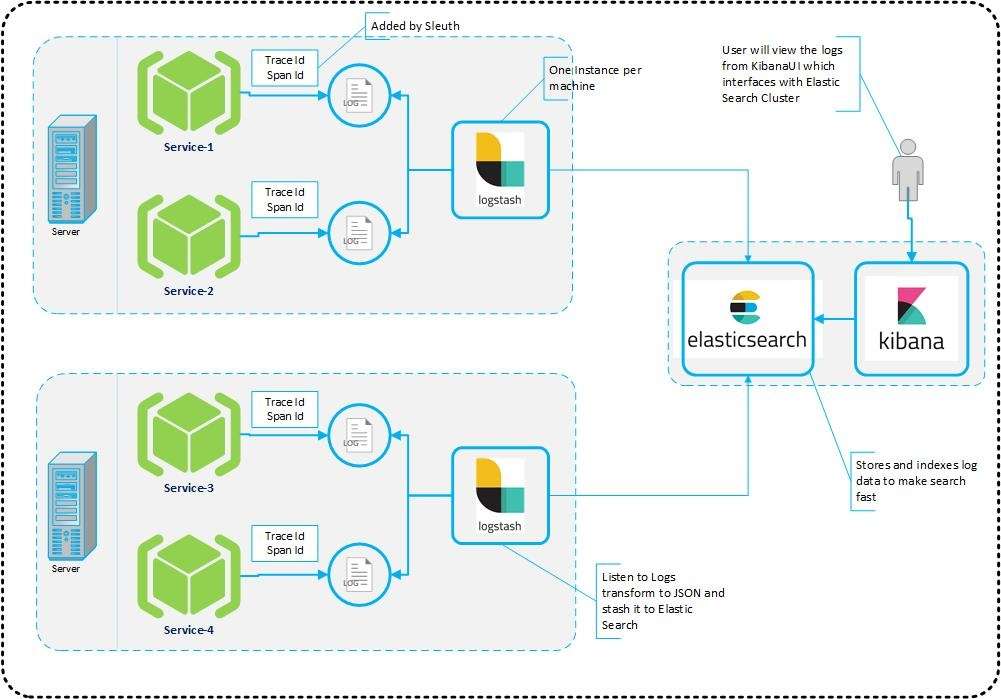
This topic describes about architecture.

It provides a comprehensive solution for handling all the required facets.

Spring Cloud Sleuth also provides additional functionality to trace the application calls by providing us with a way to create intermediate logging events. Therefore, Spring Cloud Sleuth dependency must be added to the applications.

2.2 Install and Configure ELK

This topic describes about the installation and configuration of ELK.

Note:

To install and configure ELK Stack, make sure the versions of the three software’s are the same. For the exact version to be installed, refer to Software Prerequisites section in Release Notes.
The user must download the latest version for all three software’s and for installation guides, refer to links below:

2.2.1 Start Elastic Search

This topic provides systematic instructions to start Elastic Search.

  1. Navigate to Elasticsearch root folder.
  2. Use nohup to start the Elasticsearch process.
    > nohup ./bin/elasticsearch

2.2.2 Setup and Start Logstash

This topic provides the systematic instructions to setup and start Logstash.

  1. Create a new logstash.conf file that provides the required file parsing and integration for Elasticsearch.
    logstatsh.conf:
    #Point to the application logs
    input {
     file {
      type => "java"
      path => "/scratch/app/work_area/app_logs/*.log"
      codec => multiline {
       pattern => "^%{YEAR}-%{MONTHNUM}-%{MONTHDAY} %{TIME}.*"
       negate => "true"
       what => "previous"
      }
     }
    }
    #Provide the parsing logic to transform logs into JSON
    filter {
     #If log line contains tab character followed by 'at' then we will tag that entry as stacktrace
     if [message] =~ "\tat" {
      grok {
       match => ["message", "^(\tat)"]
       add_tag => ["stacktrace"]
      }
     }
    
     #Grokking Spring Boot's default log format
     grok {
      match => [ "message",
                 "(?<timestamp>%{YEAR}-%{MONTHNUM}-%{MONTHDAY}
    %{TIME}) %{LOGLEVEL:level} %{NUMBER:pid} --- \[(?<thread>[A-Za-z0-9-]+)\] [A-Za-z0-9.]*\.(?<class>[A-Za-z0-9#_]+)\s*:\s+(?<logmessage>.*)",
                 "message",
                 "(?<timestamp>%{YEAR}-%{MONTHNUM}-%{MONTHDAY} %{TIME}) %{LOGLEVEL:level} %{NUMBER:pid} --- .+? :\s+(?<logmessage>.*)"
                ]
     }
      # pattern matching logback pattern
      grok {
             match =>
     { "message" => "%{TIMESTAMP_ISO8601:timestamp}\s+%{LOGLEVEL:severity}\s+\[%{DATA:service},%{DATA:trace},%{DATA:span},%{DATA:exportable}\]\s+\[%{DATA:environment}\]\s+\[%{DATA:tenant}\]\s+\[%{DATA:user}\]\s+\[%{DATA:branch}\]\s+%{DATA:pid}\s+---\s+\[%{DATA:thread}\]\s+%{DATA:class}\s+:\s+%{GREEDYDATA:rest}"
     }
       }
       #Parsing out timestamps which are in timestamp field thanks to previous grok section
       date {
        match => [ "timestamp" , "yyyy-MM-dd HH:mm:ss.SSS" ]
       }
      }
      #Ingest logs to Elasticsearch
      output {
       elasticsearch { hosts => ["localhost:9200"] }
       stdout { codec => rubydebug }
      }
  2. Start the Logstash process using below command.
    >nohup ./bin/logstash -f logstash.conf

2.2.3 Setup and Start Kibana

This topic provides the systematic instructions to setup and start Kibana.

  1. Navigate to the kibana.yml available under <kibana_setup_folder>/config.
  2. Modify the file to include the below:
    #Uncomment the below line and update the IP address to your host machine IP.
    server.host: "xx.xxx.xxx.xx"
    #Provide the elasticsearch url. If this is running on the same machine then you can use the below config as is
    elasticsearch.url: "http://localhost:9200"
  3. Start the Kibana process using the below command.
    >nohup ./bin/kibana