This topic provides the systematic instructions to maintain the use case details, define the use case type, and data source details.
Specify User ID and Password, and login to Home screen.
- On Home screen, click Machine Learning. Under Machine Learning, click Model Definition.
- On View Model Definition screen, click
 button on the Use case tile to Unlock or click
  button to create the new model definition.
The
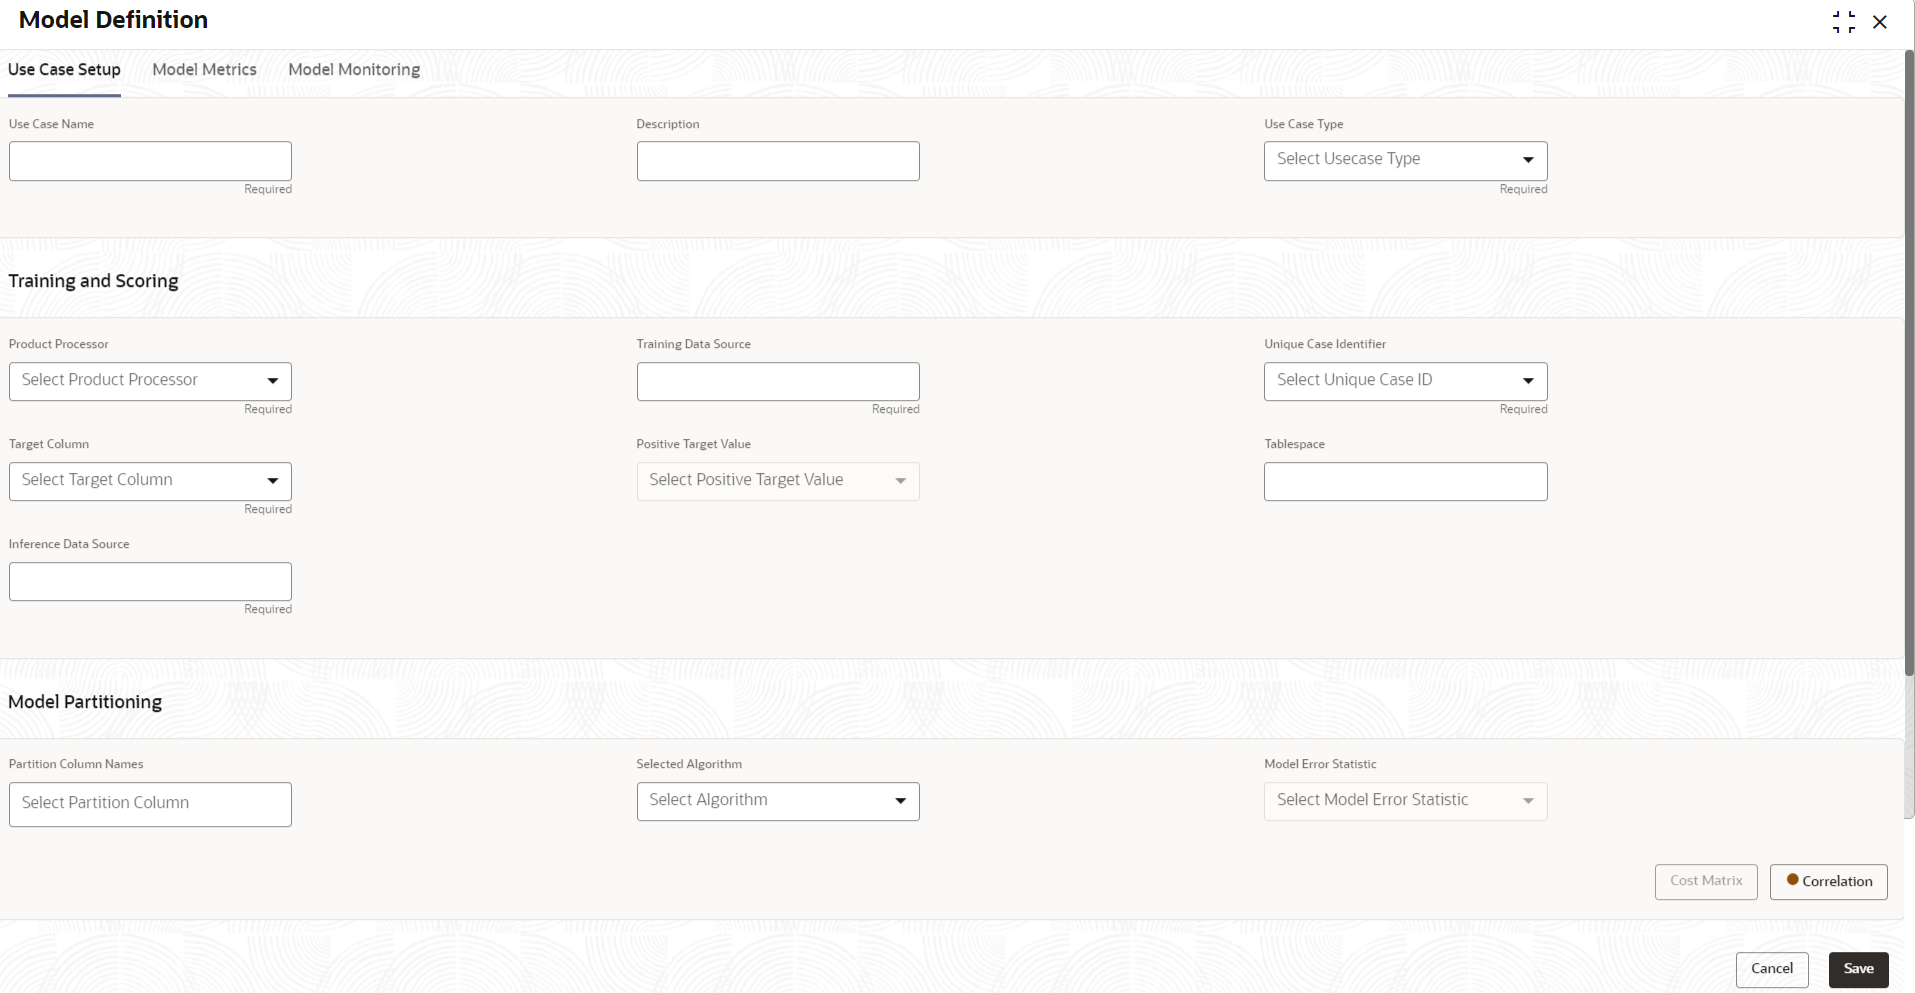
Model Definition screen displays.
- Specify the fields on Model Definition screen.
Note:
The fields marked as
Required are mandatory.
For more information on fields, refer to the field description table.
- Click Save to save the details.
The user can view the configured details in the Model Definition
screen.
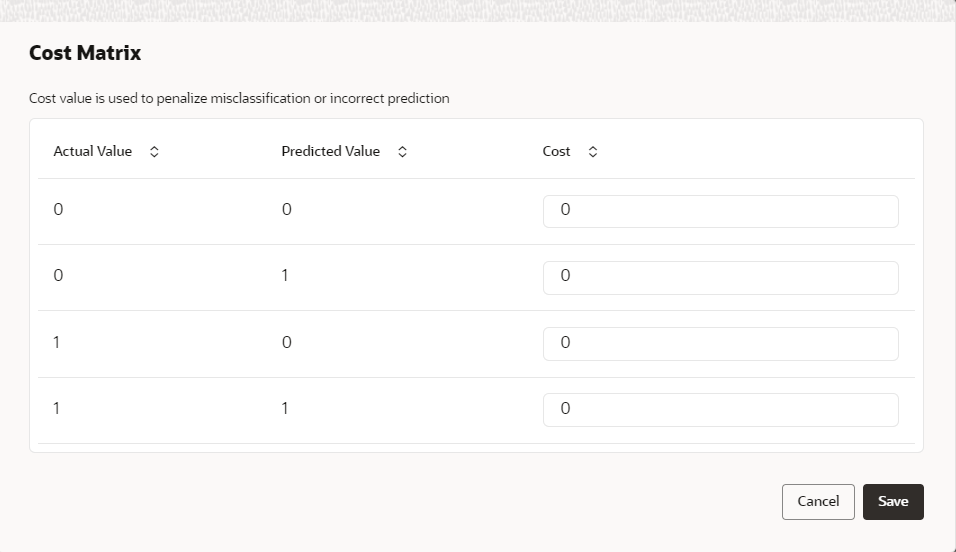
Cost Matrix:
This button is enabled ONLY for CLASSIFICATION type
of use cases.
Any classification model can make two kinds of error
This screen is used to bias the model into minimizing one of the
error types, by adding a penalty cost.
All penalty cost has to be positive.
The default is zero cost for all combinations.
Biasing the
model is a trade-off with accuracy of prediction. Business determines if a
classification model is required to be biased or not.
- Click Cost Matrix button to launch the screen.
The
Cost Matrix screen displays.
- On Cost Value screen, specify the relevant penalty
cost.
- Click Save to save and close the Cost Matrix screen and back to the Model Definition screen.
Correlation:Multicollinearity occurs when two or more
independent variables are highly correlated with one another in a model.
Multicollinearity may not affect the accuracy of the model as much,
but we might lose reliability in model interpretation.
Irrespective of
CLASSIFICATION or REGRESSION, all use cases must be evaluated for
Correlation.
This button will display Orange mark if evaluation is
pending.
- Click Correlation button to launch the screen.
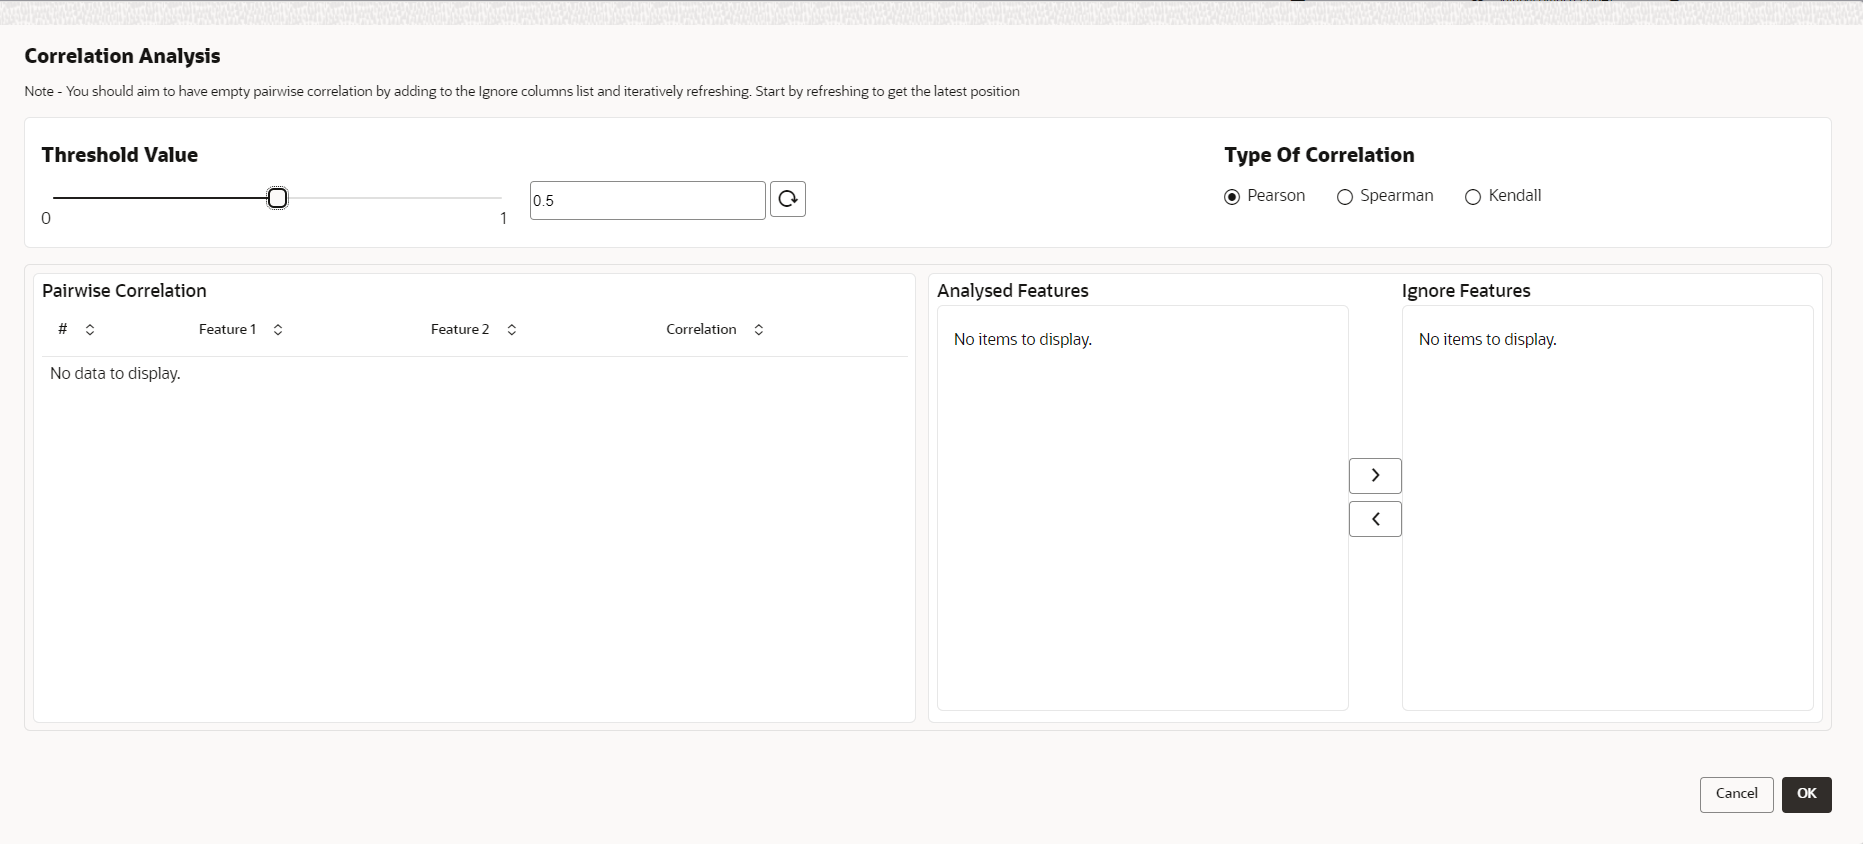
The
Correlation Analysis screen displays.
- Select the required fields on Correlation Analysis screen.
For more information on fields, refer to the field description table.
- Click
 to initiate the evaluation process.
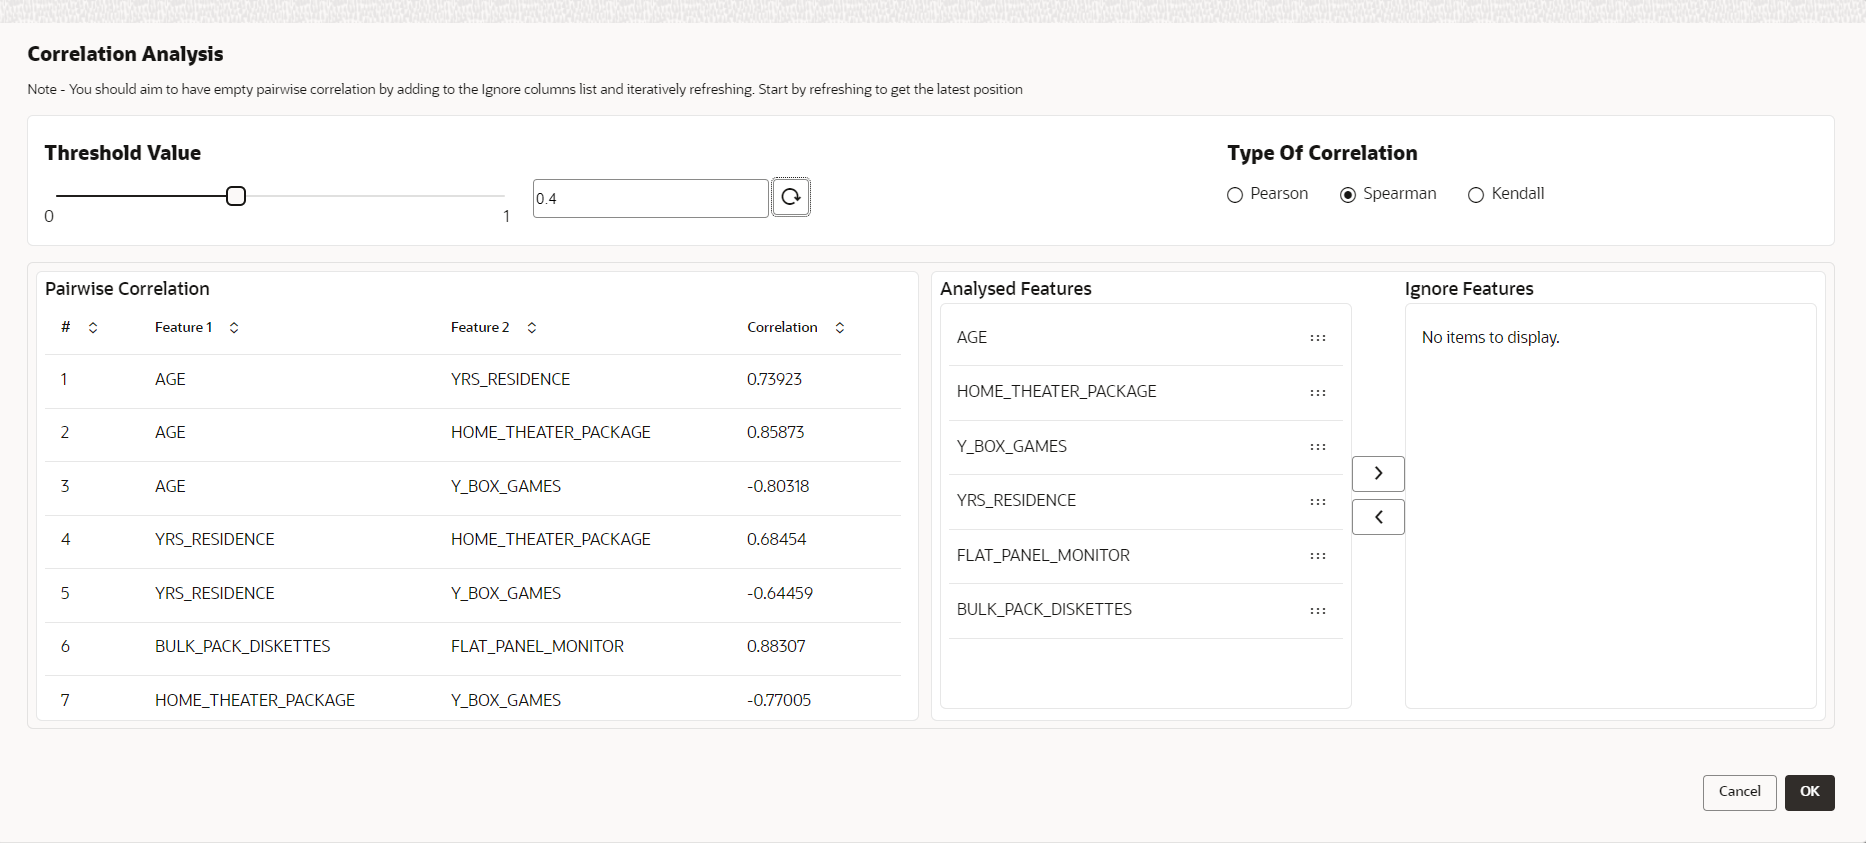
The
Correlation Analysis - Pairwise Correlation
screen displays.
- Move ONE of the Analyzed Features to Ignore Features List.
- Click
 and re-evaluate Correlation as mentioned in Step 8.
- Rinse and repeat the Step 9 and 10 for each feature addition to the Ignore feature list, until Pairwise Correlation displays zero correlated pair.
- Attempting to exit the screen midway without achieving zero Pairwise
Correlation, will display the following error message.
The
Error Message screen displays.
- After successful Correlation Evaluation, the orange
highlight on the Correlation button is removed.
- After Correlation Evaluation and Cost Matrix
definition (for CLASSIFICATION)
- Click Save to create the new Model Definition.
The user can view the configured details in the View Model Definition screen.
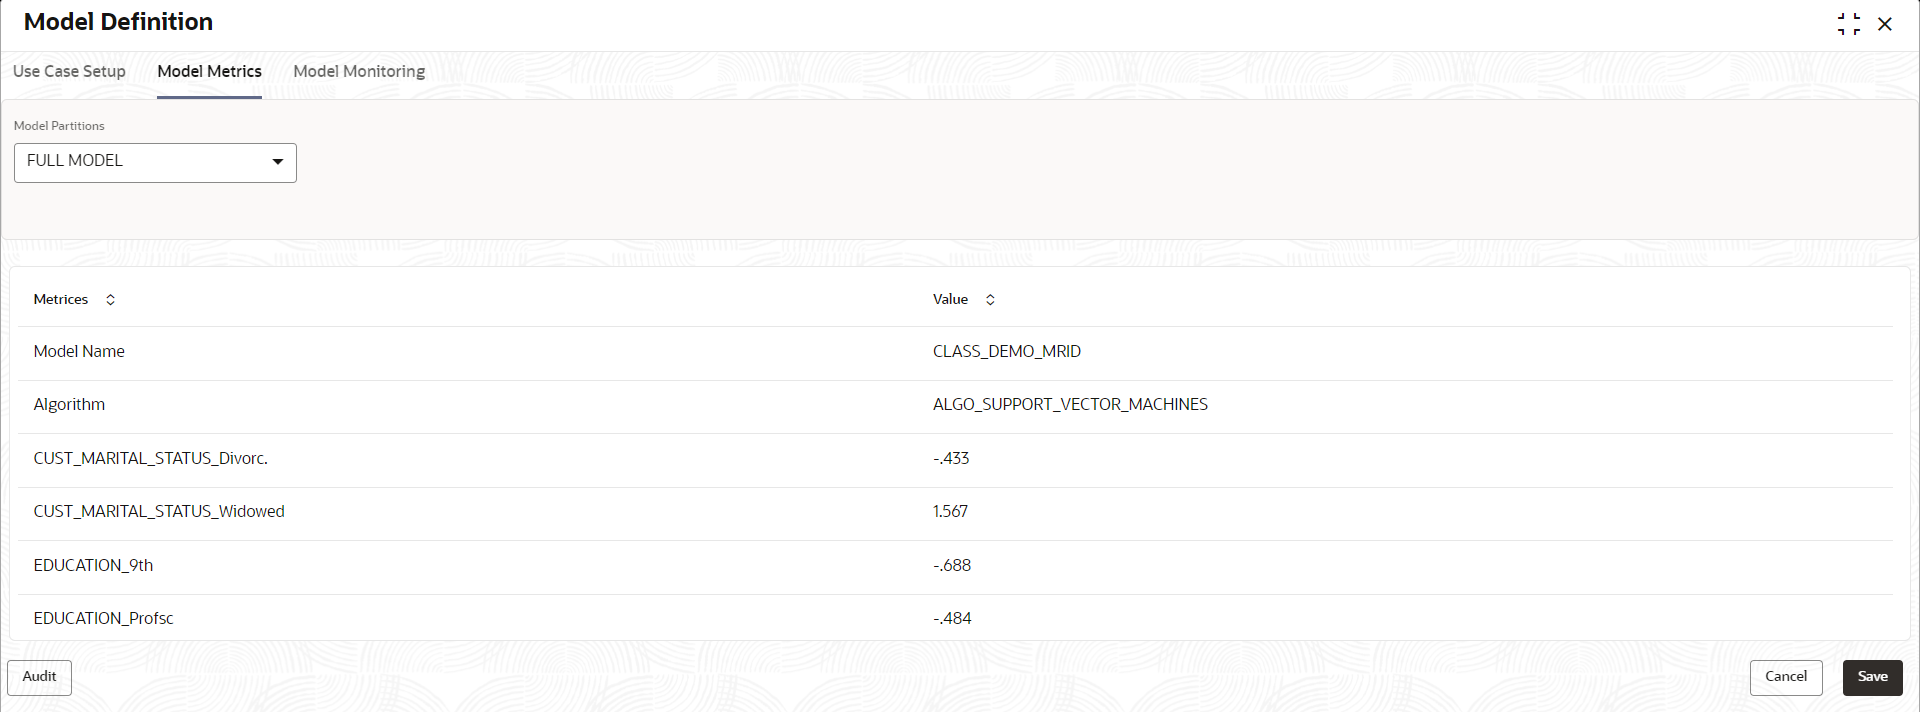
Model Metrices
Once the user has successfully trained
Machine Learning model, the user can score/predict the model outcomes as
required by the use case. The user can view the Model
Metrices screen only after training the model successfully.
Refer to Model Training and Scoring section for training
the model.
- Click Model Metrices to view the Model Metrices
details.
The
Model Metrices screen
displays.
For more information on fields, refer to the field description table.
 button on the Use case tile to
  button to create the new model definition.