17.2 Accessing the Standard Reports and Dashboards
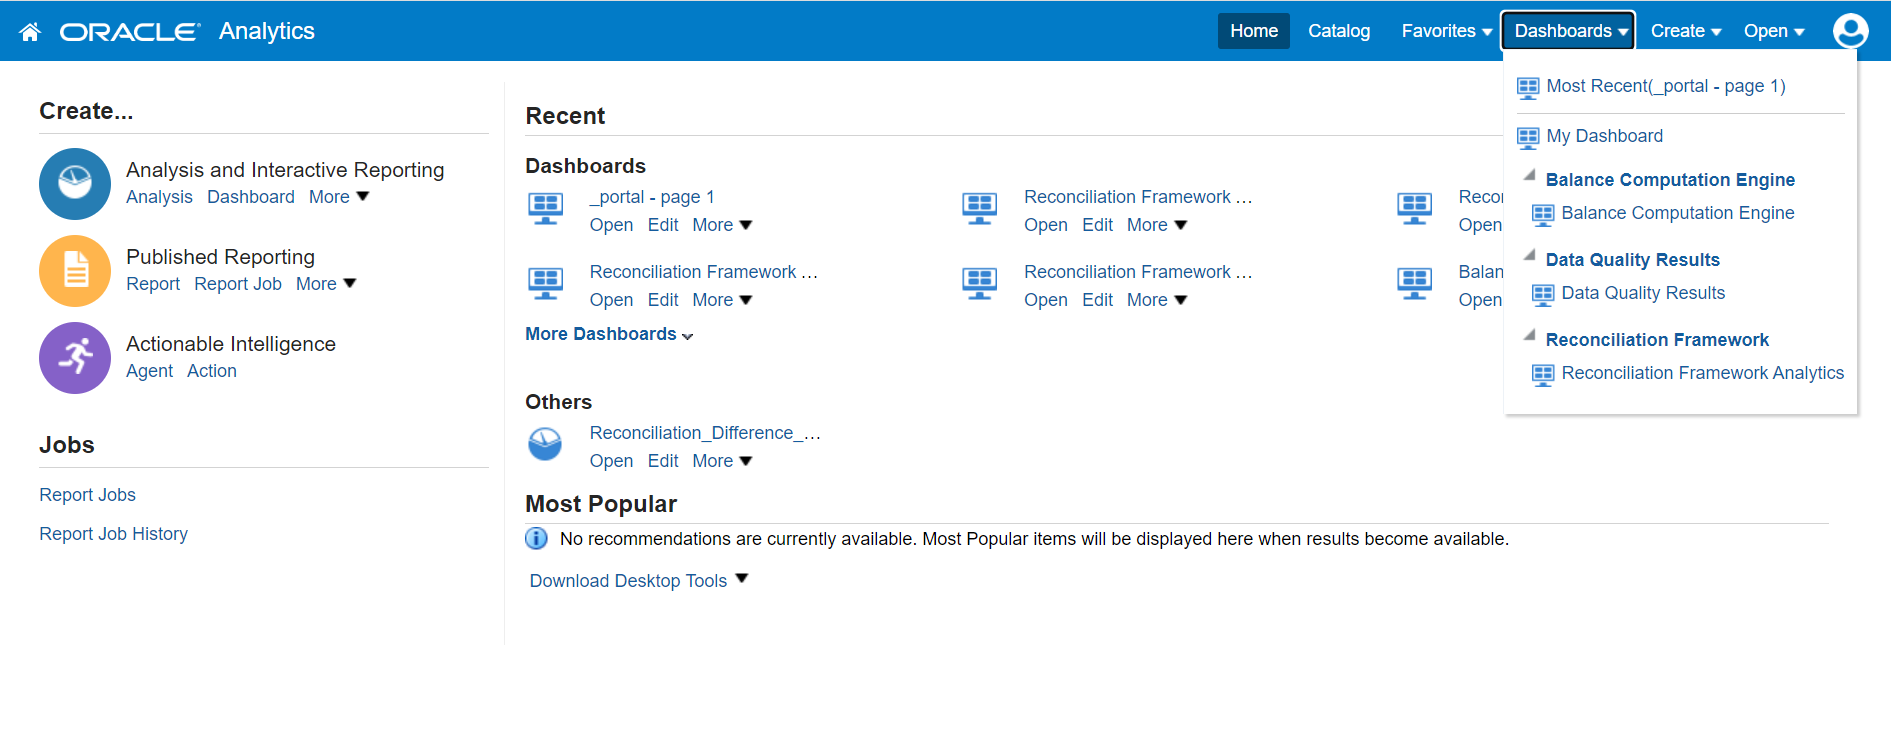
To access standard dashboards and reports, from the the Left Hand Side menu on the Home page of AFCS, click Dashboards. You will see basic summary reports. On the page header, click the Dashboards menu to view the list of all available seeded dashboards.
Figure 17-1 Analytics page- Seeded Dashboards

Balance Reconciliation Analytics provides these dashboards:
- Home
- Threshold Breach
- Reconciliation Execution Audit Trail
- Map Filter Report
Note:
Reconciliation difference drill down report is deprecated from 23.4.1 version onwards.Each seeded dashboard has options at the top of the page, which you must select for the reports you wish to see. The Home, and Threshold Breach dashboards consist of the following options:
- As of Date: Select the As of date and click the calendar icon.
- Execution ID: All successful Run executions with status marked Complete in the Run Execution Summary window are populated here. Select the appropriate Run Execution ID from the drop-down menu.
Select the opions and click Apply. To refresh the data, click Reset.
The Reconciliation Execution Audit Trail dashboard consists of the following options:
- User ID: Data is displayed based on the User ID selected from the drop-down list.
- Information Type: Available options are Null, Error, or Info.
- Execution Date: Select the date on which the Run is executed.
The Map Filter Report Dashboard consists of the following options:
- Execution ID: All successful Run executions with the status marked as Complete in the Run Execution Summary window are populated here. Select the appropriate Run Execution ID from the drop-down list.
- GL Map ID: The General Ledger Map identification numbers are populated here. Select the appropriate GL Map ID from the drop-down list.
- Map Version Number: The map version numbers are populated here. Select the appropriate Map Version Number from the drop-down list.
A few reports also have filters at each reporting level which are detailed in the section 'Report Descriptions'. Select the appropriate report filters so that data is displayed accordingly. For each report within a dashboard, you can also perform these tasks:
- Refresh: Use this to update the values displayed in the report.
- Print: Use this to print a particular report.
- Export: Use this to export data into multiple formats such as PDF, Microsoft Excel, Microsoft PowerPoint, and so on.
- Return: To navigate back to the previous window.
- Create Bookmark Link: To share or save a browsed page. Sort icons also appear on each tabular report to sort the data in ascending or descending order. A few reports also consist of a drill-through capability wherein you can navigate to the most granular level of data.