- Analytical Application Infrastructure User Guide
- Operations
- Batch Monitor
- Monitoring Batch
Monitoring Batch
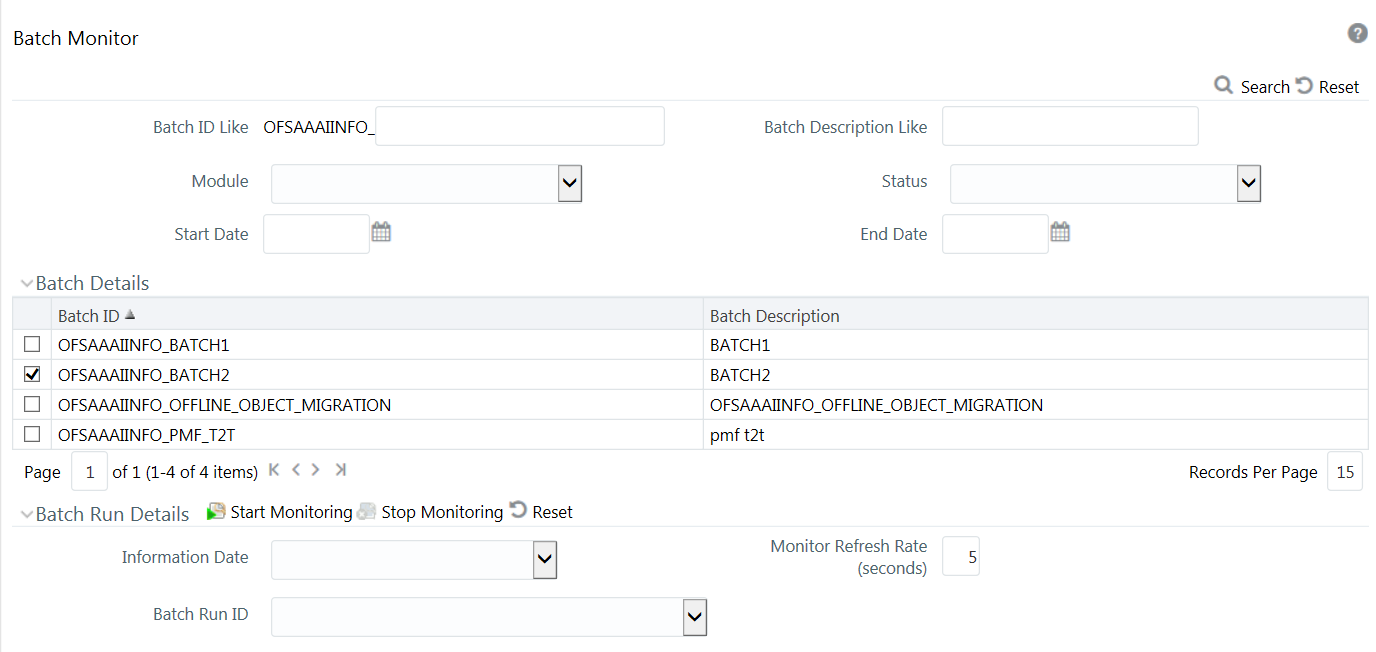
The Batch Details section in the Batch Monitor window lists all the Batches which are schedule or executed within the Infrastructure system.
You can view and monitor the required Batch definitions and the corresponding task
details. You can also export the values in Microsoft Excel format for reference.

Figure 13-8 Batch Monitor window

To monitor a Batch in the Batch Monitor window:
- Select the checkbox adjacent to the Batch ID whose details are to be
monitored.You can also search for a specific Batch by using the Search option and filter the search results by selecting the required Status as Successful, Failed, Held, or Not Started in the drop-down list.
- Enter the Batch Run Details as tabulated.The following table describes the fields in the Batch Run Details window.
Table 13-4 Fields in the Batch Run Details window and their Descriptions
Field Description Information Date Select the information date from the drop-down list which consists of recently executed Batch Information dates. Monitor Refresh Rate Specify the refresh rate at which the latest Batch status details have to be fetched in seconds. You can enter a value between 5 to 999 seconds.
NOTE: The default value of Monitor Refresh Rate is set to 10 seconds.
Batch Run ID Select the Batch Run ID from the drop-down list which consists of Batch ID’s form which the Batch has been executed. - Click Start Monitoring button in the Batch Run Details
tool bar. The state of the selected Batch is monitored and status is displayed in the following order:
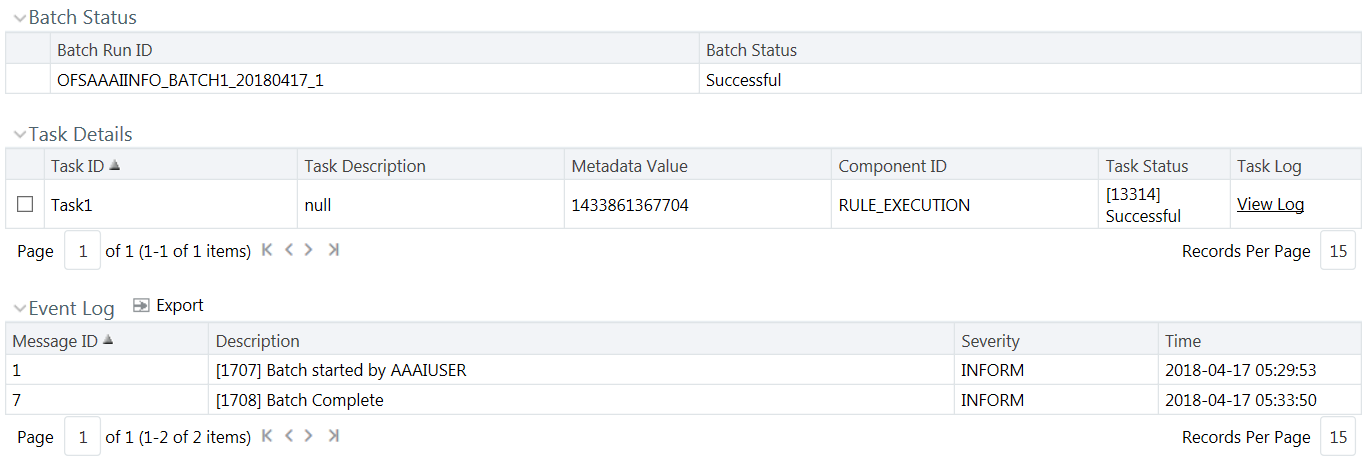
Figure 13-9 Batch Status pane

- The Batch Status pane displays the Batch Run ID
with the Batch Status as Successful, Failed, Held, or Not Started.
- Successful- Batch execution is successful.
- Failed- Batch execution failed. A notification mail is sent to all users mapped to the user groups with the OPRMON role mapped to them. The mail will show the exact task status as Not Run, Excluded, Held, Interrupted, Indeterminate and Cancelled.
- Held- Batch execution is put on hold.
- Not Started- Batch execution has not started.
- The Task Details section displays the executed
task details such as Task ID, Task Description, Metadata Value, Component
ID, Task Status and Task Log. Click View Log link to
view the View Logger window. You can select the checkbox adjacent to the
Task ID to view the task component execution details in Event Log section.
Note:
If the component used in the task is Data Transformation, the status will be Successful or Failed based on the invocation of function/procedure is successful or failure. The errors produced by PL/SQL will not have impact on task status unless it throws an oracle exception. - The Event Log section displays the list of errors
and events of the Batch being executed. The events are displayed in the
ascending order with the latest event being displayed at the top. The Event
log consists of:
- Message ID, which is auto generated.
- Description, which has the error details.
- Severity, which can be Fatal, Inform, or Successful.
- Time, which indicates the time of the event.
- In the Batch Run Details tool bar, you can do the following:
- Click Stop Processing button to stop the Batch monitoring process.
- Click Reset button to reset Batch Run Details.
- The Batch Status pane displays the Batch Run ID
with the Batch Status as Successful, Failed, Held, or Not Started.
- In the Event Log tool bar, you can click Export button to export the event log details to Microsoft Excel file for reference.