13.11 Varying the At-Risk Period
This example tries to give intuition behind the numbers by varying the At-Risk period for a typical case. The instrument we analyze is a two-year discount bond with a principal of $100. The market value is $78.
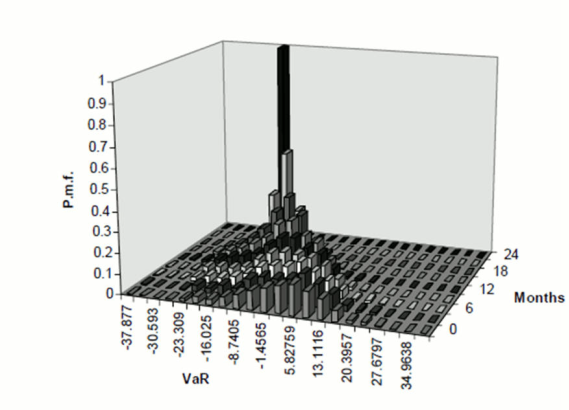
To ease comprehension of the graph, we display the probability mass function and not the cumulative probability distribution.
Figure 13-7 Graph of Probability Mass Function

Description of graph of Probability Mass Function follows:
This graph reflects two important features of a fixed-rate instrument:
- On average, VaR decreases with time because the dynamic present value increases with time.
- The dispersion of VaR goes to zero when approaching maturity.