6.1.4.4 Data Quality Checks
To access the Data Quality Checks report, from the LHS menu, select Operational Analysis, and then select Data Quality Checks.
Data Quality Check Reports are divided into four canvases.
- DQ Check Platform Availability
- DQ Batch Executions
- DQ Results
- DQ Detail Results
DQ Check Platform Availability
You can use the following filters:
- DQ Rule Name: Rules created in the Application
- Base Table: Base tables used in the rules
- Severity Values: Error, Warning, Info
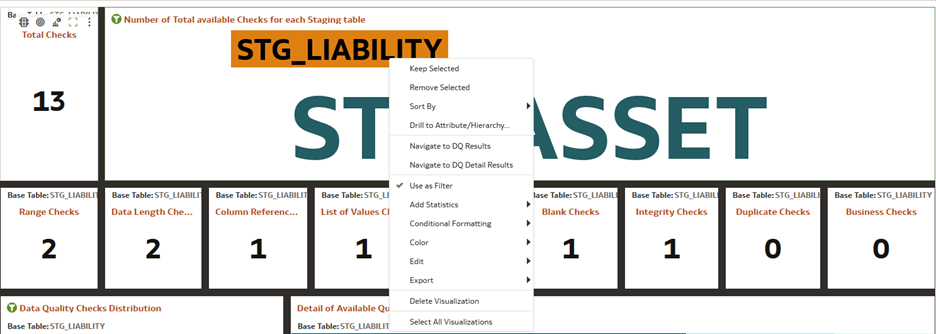
Total Checks: Number of Checks created in the OFSAA Application.
Number of Total available checks for each Staging table: Gives the information regarding number of checks based on the various staging tables.
The following reports gives the information regarding the number of various checks created.
- Range Checks: Total number of Range checks defined in the system.
- Data Length Checks: Total number of Data Length checks defined in the system.
- Column Reference Checks: Total number of Column Reference checks defined in the system.
- List of Values Checks: Total number of List of values check defined in the system.
- Null Checks: Total number of Null checks defined in the system.
- Blank Checks: Total number of Blank checks defined in the system.
- Integrity Checks: Total number of Integrity checks defined in the system.
- Duplicate Checks: Total number of Duplicate checks defined in the system.
- Business Checks: Total number of Business checks defined in the system.
Figure 6-75 Number of Total available Checks for each Staging table
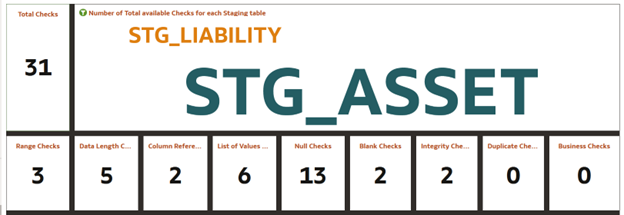
Data Quality Checks Distribution gives the distribution of checks based on the base tables.
Figure 6-76 Detail Quality Checks Distribution and Detail of Available Quality Checks in the Platform

DQ Batch Executions Canvas
This canvas gives the information regarding the Batches executed on Data Quality Checks.
You can use the following filters:
- Batch Identifier: Batches executed in the system.
- Process Identifier: Process Name for the executed batch in the system.
- Fic Mis Date: Batch execution date.
- DQ Group Identifier: Data Quality Groups created in the system.
- DQ Group Description: Description of Data Quality Groups.
- DQ Check Identifier: Data Quality checks created in the system.
- DQ Check Description: Description of Data Quality checks.
- DQ Source Table: Base table on which Data Quality check is created.
- DQ Category Name: Data Quality check category.
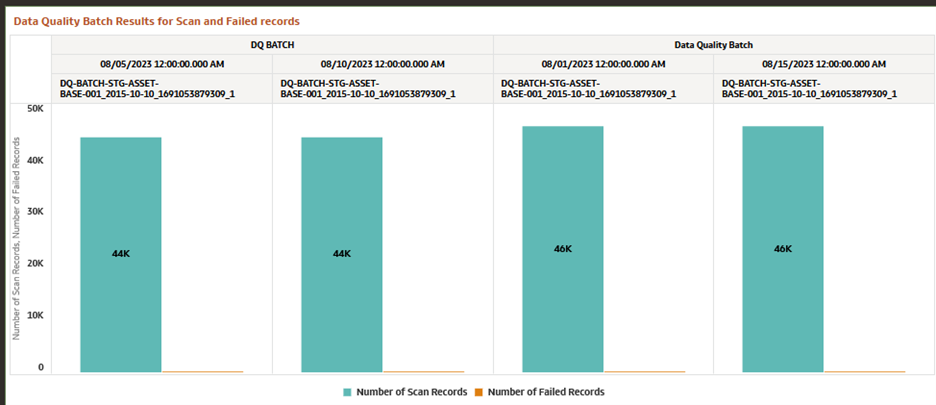
Data Quality Batch As Of Date: This report provides details on the executed checks, including the date of execution, Batch name, and the count of scanned records and failed records against each defined check and corresponding to Data Quality Category name.
Figure 6-77 Data Quality Batch As Of Date
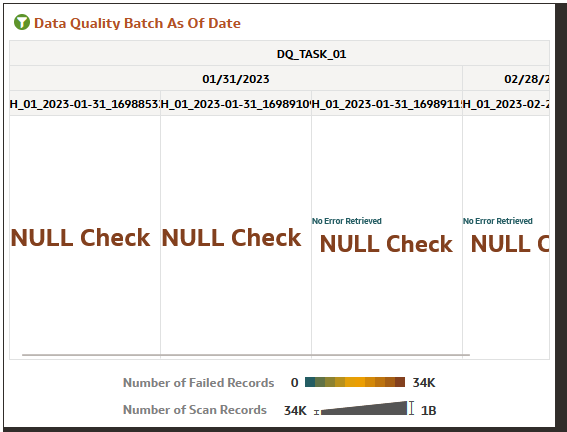
Figure 6-78 Data Quality Batch Results by Severity and Category
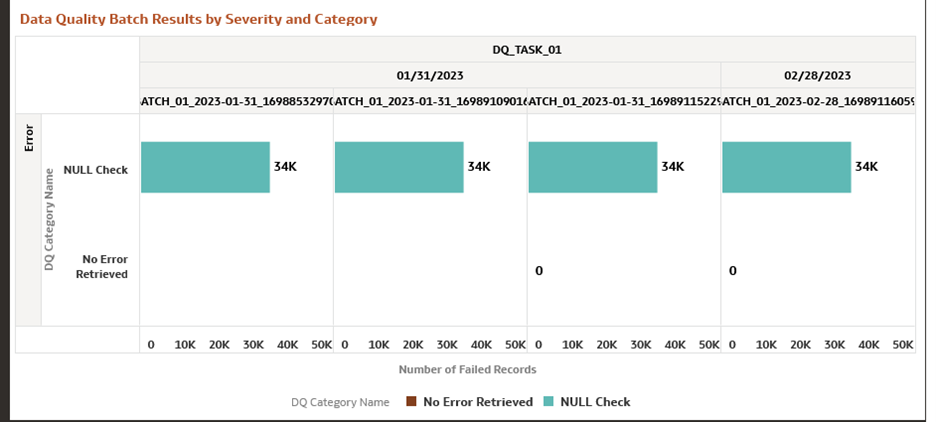
Figure 6-79 Number of Scan Records and Number of Failed Records
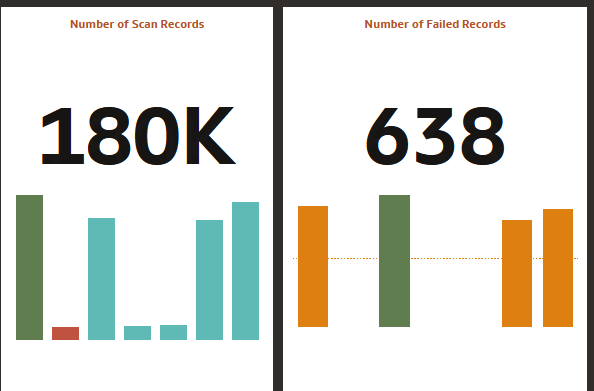
Figure 6-80 Data Quality Batch Results for Scan and Failed Records
DQ Results
You can use the following filters:
- Batch Identifier: Batches executed in the system.
- Process Identifier: Process Name for the executed batch in the system.
- Fic Mis Date: Batch execution date.
- DQ Group Identifier: Data Quality Groups created in the system.
- DQ Group Description: Description of Data Quality Groups.
- DQ Check Identifier: Data Quality checks created in the system.
- DQ Check Description: Description of Data Quality checks.
- DQ Source Table: Base table on which Data Quality check is created.
- DQ Category Name: Data Quality check category.
Figure 6-81 Number of Record Failed by DQ Category Check
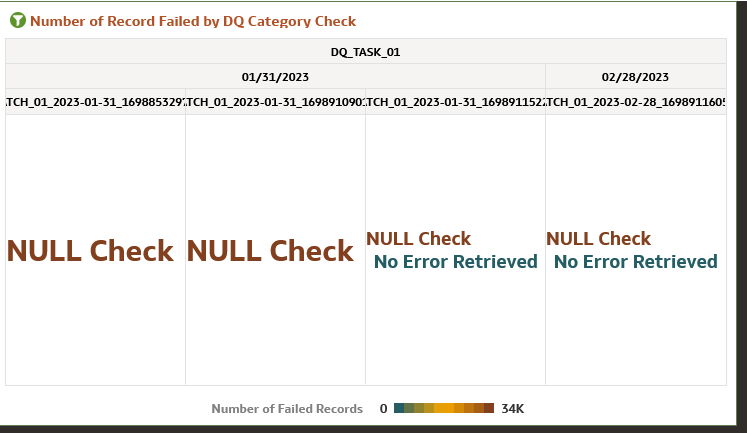
Figure 6-82 Percentage of Record Failed by DQ Category Check
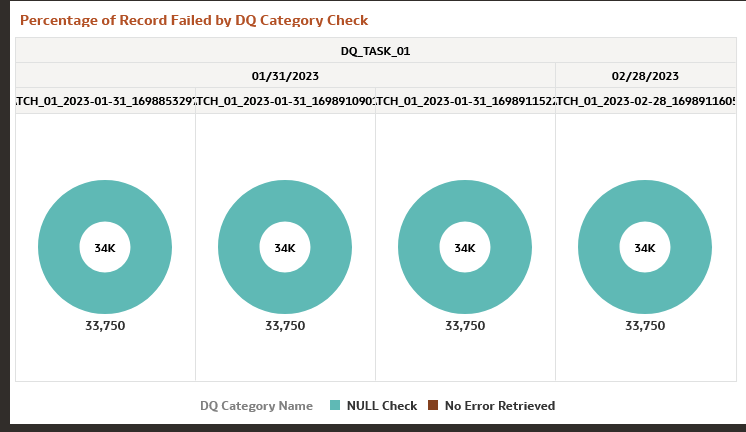
Figure 6-83 Number of Records Failed by DQ Error Value

DQ Detail Results
Figure 6-84 DQ Detail Results
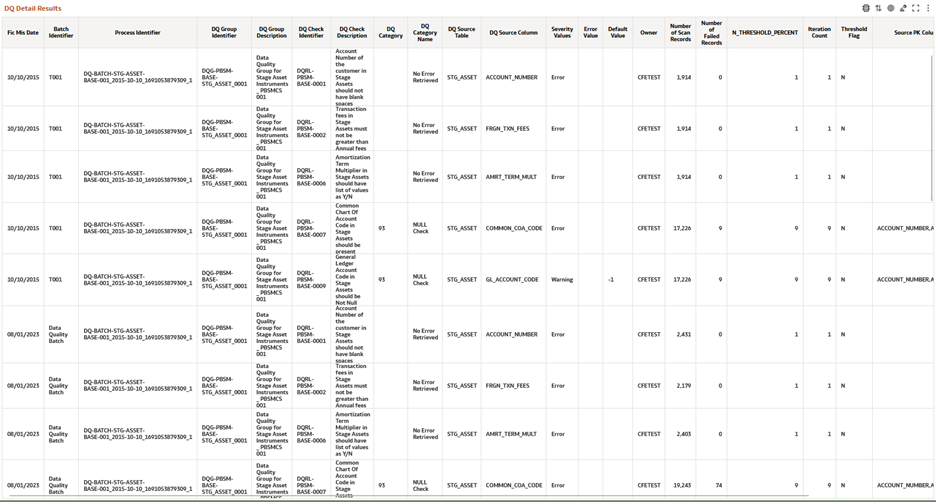
Figure 6-85 Data Action
Data Action: A Data Action link can pass context values as parameters to other canvas. In Data Quality Reports we have two data actions namely DQ Results and DQ details results.
DQ Results: When user right clicks on any element and navigates to DQ Result, the selected object will get passed as a filter and pass this filter in DQ results Canvas.
DQ Result Details: When user right clicks on any element and navigates to DQ Result Details, the selected object will get passed as a filter and pass this filter in DQ Results Details Canvas.