6.1.6.3.4 Financial Risk Runoff
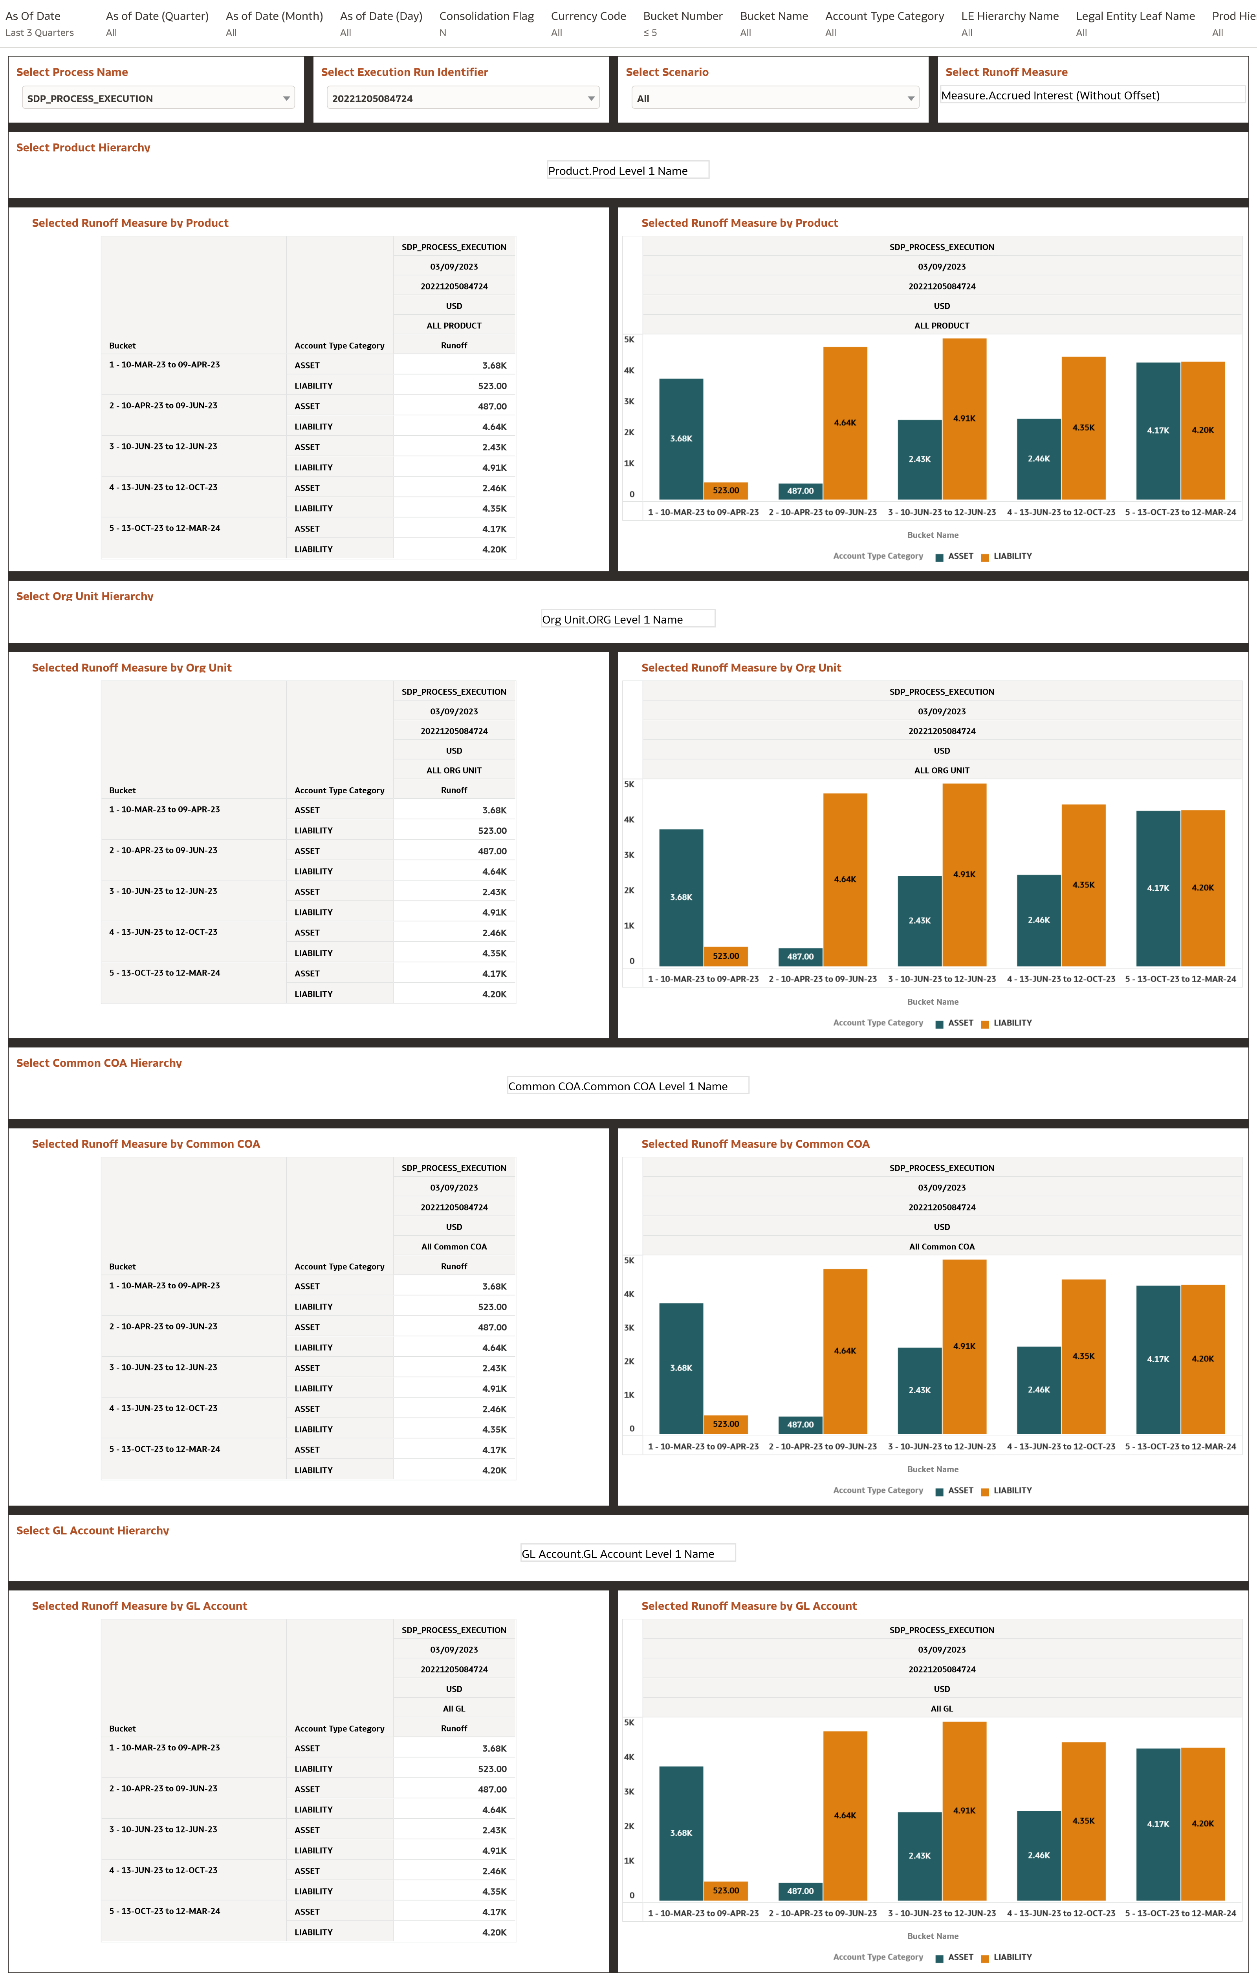
The “Financial Risk Runoff” Report is used to analyze the balances, runoff amounts, interest and related measures by time bucket.
You can use a series of Report Prompts, as previously described, to filter the data according to key attributes pertaining to the underlying Financial Risk Output results.
The report displays the underlying data according to the following Chart’ logic:
- Select Process Name
The List box filter provides you with a selection capability on the desired Process Name utilized by the Financial Risk Output processes.
- Select Execution Run Identifier
The List box filter provides you with a selection capability on the desired Execution Run Identifier utilized by the Financial Risk Output processes. This filter is dependent on the values selected in the Process Name filter.
- Select Scenario
The List box filter provides you with a selection capability on the desired Scenario utilized by the Financial Risk Output processes. This filter is dependent on the values selected in the Process Name, Execution Run Identifier filter.
- Select Dynamic Start Date
The List box filter provides you with a selection capability on the desired Dynamic Start Date utilized by the Financial Risk Output processes. This filter is dependent on the values selected in the Process Name, Execution Run Identifier, and Scenario filter.
- Select Runoff Measure
The chart provides you with a selection capability on the desired Financial Risk Runoff measurement.
- Select Org Unit Hierarchy
The chart provides you with a selection capability for the desired Org Unit Hierarchical level.
- Select Product Hierarchy
The chart provides you with a selection capability for the desired Product Hierarchical level.
- Select GL Account Hierarchy
The chart provides you with a selection capability for the desired GL Account Hierarchical level.
- Select COA Hierarchy
The chart provides you with a selection capability for the desired Common COA Hierarchical level.
- Selected Runoff Measure by Product
The table and chart reports the generated Interest Rate Risk output Runoff Measure by Product for each Financial Risk Output execution with respect to As of Date and Bucket Name.
The columns displayed in the chart are the following:
- Bucket Name
- Account Type Category
- Process Name
- As of Date (Day)
- Execution Run Identifier
- Currency Code
- Product Hierarchy
- Runoff Measure
- Selected Runoff Measure by Org Unit
The table and chart reports the generated Financial Risk output Runoff Measure by Org Unit for each Financial Risk Output execution with respect to As of Date and Bucket Name.
The columns displayed in the chart are the following:
- Bucket Name
- Account Type Category
- Process Name
- As of Date (Day)
- Execution Run Identifier
- Currency Code
- Org Unit Hierarchy
- Runoff Measure
-
Selected Runoff Measure by GL Account
The table and chart reports the generated Financial Risk output Runoff Measure by GL Account for each Financial Risk Output execution with respect to As of Date and Bucket Name.
The columns displayed in the chart are the following:
- Bucket Name
- Account Type Category
- Process Name
- As of Date (Day)
- Execution Run Identifier
- Currency Code
- GL Account Hierarchy
- Runoff Measure
-
Selected Runoff Measure by Common COA
The chart reports the generated Financial Risk output Runoff Measure by Product for each Financial Risk Output execution with respect to As of Date and Bucket Name.
The columns displayed in the chart are the following:
- Bucket Name
- Account Type Category
- Process Name
- As of Date (Day)
- Execution Run Identifier
- Currency Code
- Common COA Hierarchy
- Runoff Measure
Figure 6-145 Financial Risk Runoff Report
