7.2 Homepage Options
The default Hompage which displays upon login is dependent on your user role.
To navigate to the Scenario Tuning application, select the Scenario Tuning option from the Reports primary navigation menu. On successful login, the homepage is displayed with Reports menu option. On clicking the Reports option, the OBIEE Dashboard page is displayed.
- When the User is an Administrator: Users with administrator or data miner roles will default to the Scenario Tuning Report. If you have logged out from the Answers page, the next time you login you are directly taken to the Answers page.
- When the User is not an Administrator: If you are not an Administrator, the
Homepage is always the dashboard.
On login, if dashboard is displayed as home page, you can see four dashboards–AML, Fraud, Productivity, and Scenario Tuning. By default, the dashboard seen is AML.
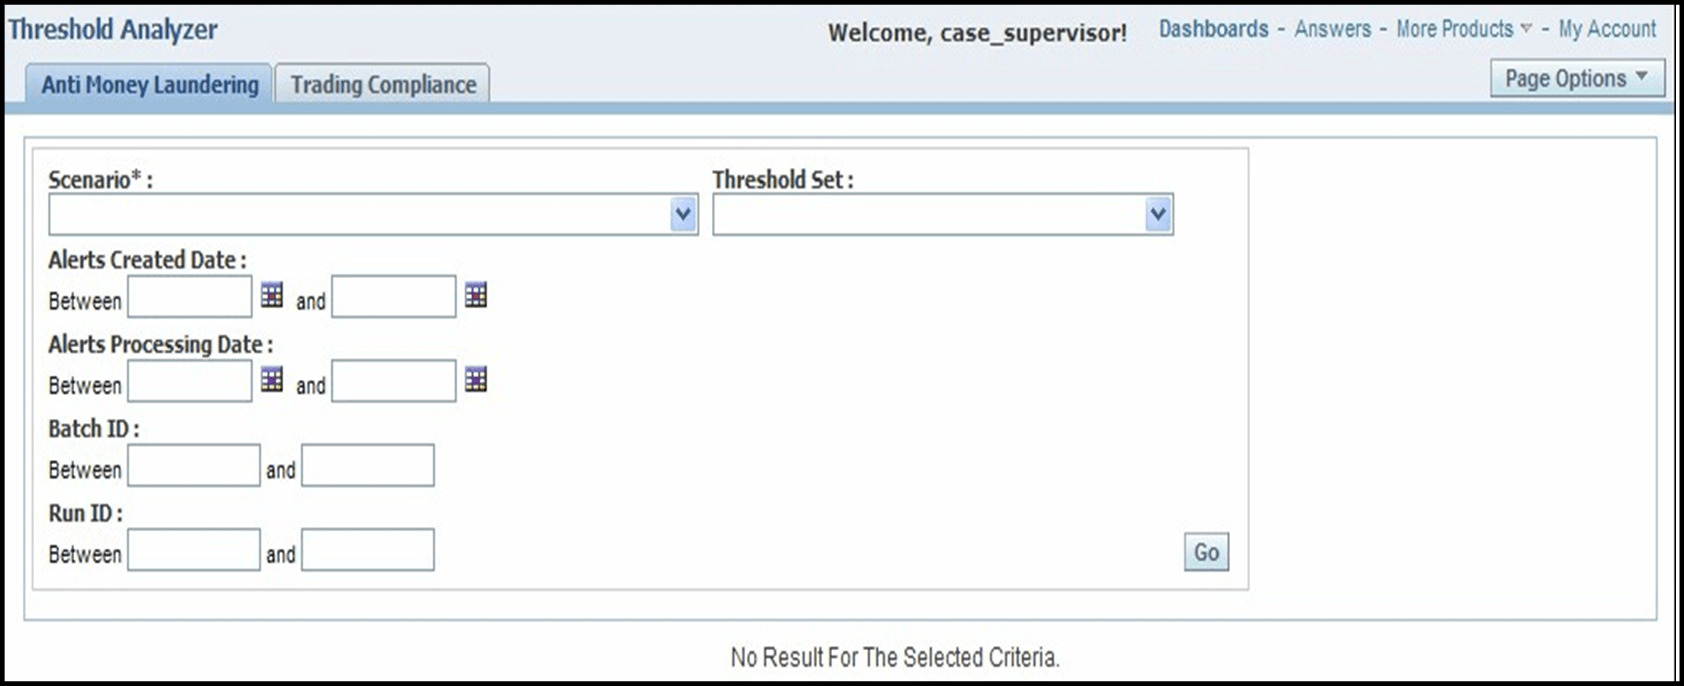
Click Scenario Tuning to view the Scenario Tuning dashboard. Here, you can see a tab for each scenario class for which scenarios have been installed. For example, Anti Money Laundering and Trading Compliance scenarios have been installed.
Initial Report Filters
- Scenario: This field is mandatory to specify and lists scenarios associated to the corresponding scenario class. The values in the Scenario drop-down contain the scenario name concatenated with the focus type in parenthesis.
- Threshold Set: Values in this field are populated depending on the scenario selected. If the scenario is changed, the Threshold Set values corresponding to that scenario are populated. Initially, when no scenario is selected, the drop-down lists all possible threshold sets associated with your set of scenarios.
- Alerts Created Date: The alert created date represents the system
date of the creation of the alert. In this date filter, you can specify the
date range by entering a from and to date (represented by the Between and
fields) or selecting the dates using the calendar control. The from date
should always be less than the to date. Data must be in the MM/DD/YYYY
format. By default, the date fields are blank.
If you enter only a from date, keeping the to date blank, the system fetches the data based on where the alert created date is greater than or equal to the given date. Similarly, if you enter only a to date then the system fetches data based on where the alert created date is less than or equal to the given date.
- Alerts Processing Date: The alert processing date represents the
business date associated with the creation of the alert. In this date
filter, you can specify the date range by entering a from and to date
(represented by the Between and and fields) or selecting the dates using the
calendar control. The from date should always be less than the to date. Data
must be in the MM/DD/YYYY format. By default, the date fields are
blank.
If you enter only a from date, keeping the to date blank, the system fetches the data based on where the alert processing date is greater than or equal to the given date. Similarly, if you enter only a to date then the system fetches data based on where the alert processing date is less than or equal to the given date.
- Batch ID: Behavior detection cycles are associated with a processing
batch, which is assigned a unique identifier for each execution of the
detection batch cycle. Using this filter you can specify a range of batch
identifiers by entering from and to batch identifier values (represented by
the Between and and fields) in the text box. Only positive values can be
entered in these text boxes. The from Batch ID value should always be less
than the to Batch ID value. You are allowed to enter only numeric values in
these fields.
If only a from Batch ID is entered then the report fetches data based on where the batch identifier is greater than or equal to the given batch ID. Similarly, if you enter only a to Batch ID then the report fetches data based on where the batch identifier is less than or equal to the given value.
- Run ID: Within a behavior detection batch cycle, detection jobs are
associated with job runs. Each job run receives a unique run identifier.
Using this filter you can specify a range of run identifiers, or individual
identifiers in a similar manner as described for the Batch ID filter. As for
the Batch ID filter, the Run ID filter accepts only positive values and the
from Run ID value should always be less than the to Run ID value and the
filter accepts only numeric values.
If only a from Run ID is entered then the report fetches data based on where the run identifier is greater than or equal to the given run ID. Similarly, if you enter only a to Run ID then the report fetches data based on where the run identifier is less than or equal to the given value.
Executing a Scenario Tuning Report
By default, the Scenario Tuning reports are not displayed upon login and the page shows the No Result For The Selected Criteria message.
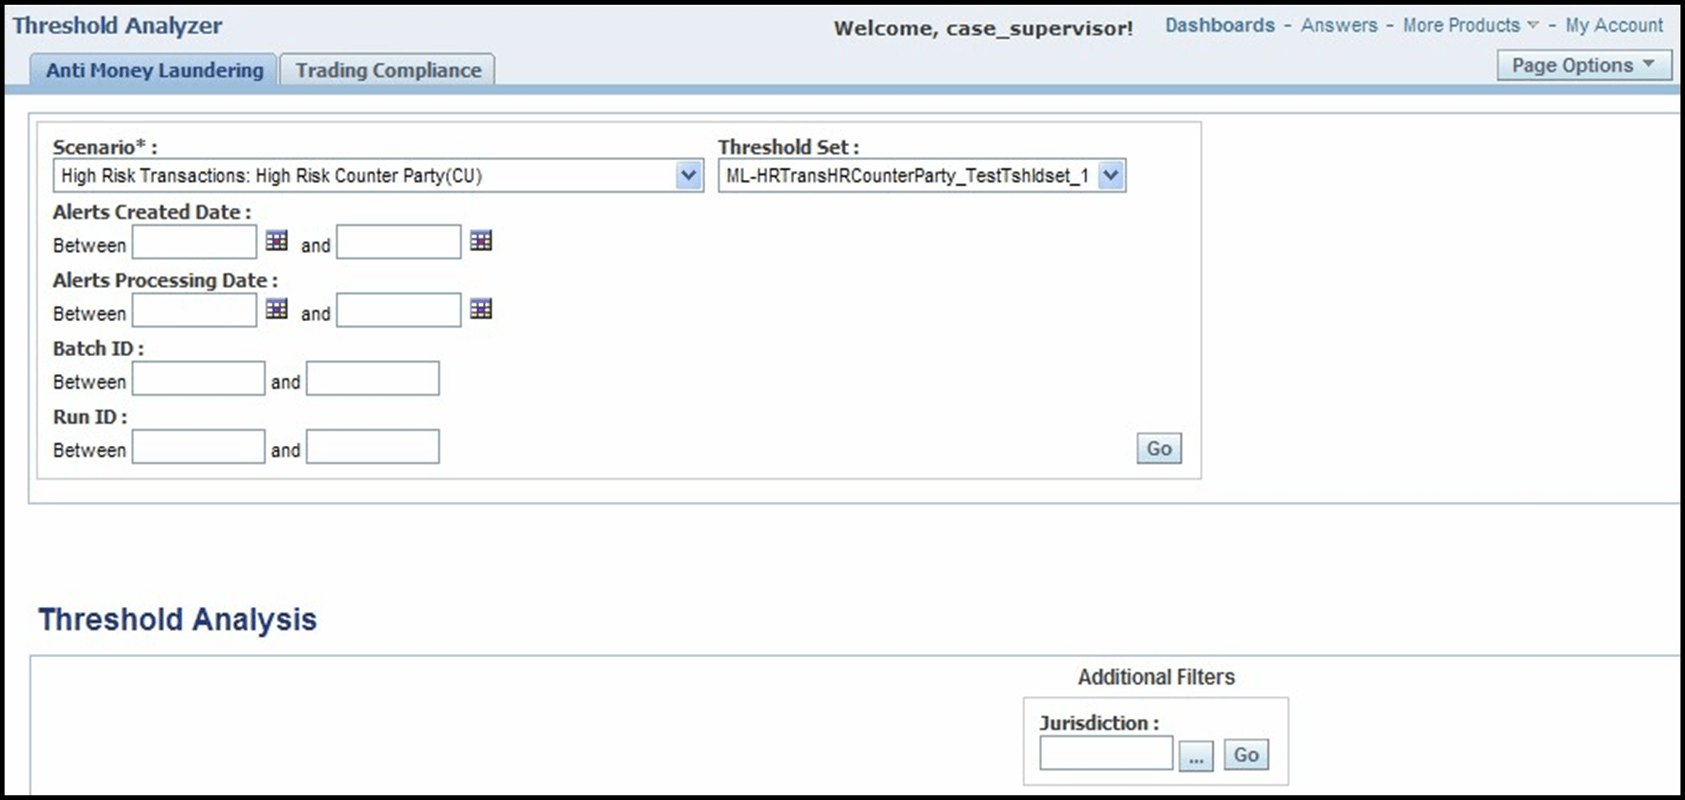
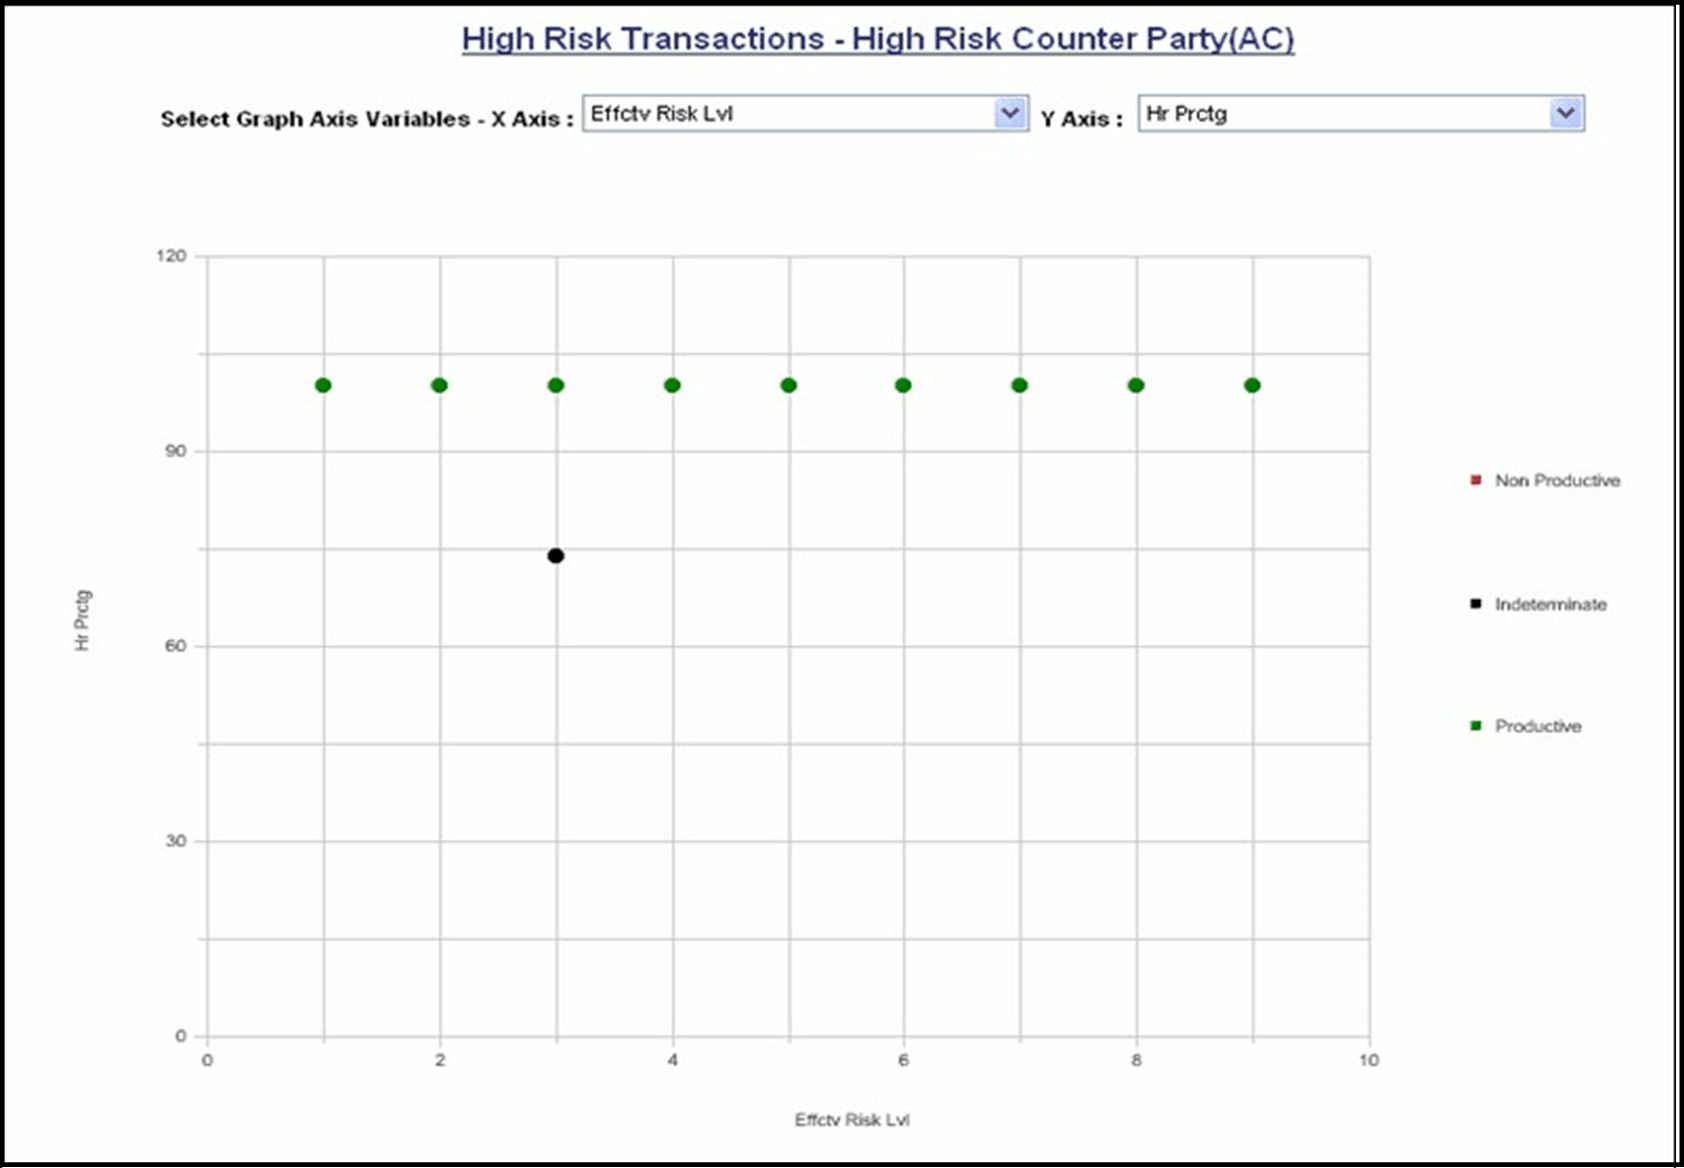
To view the report, enter search values in your desired filters and click Go. The Additional Filters selection section opens and the Scenario Tuning scatter graph statistical reports and their associated graphs open. For information about understanding graph display, see Understanding the Graph Display.
Using Additional Filters
To specify a value for use as an additional filter, click on the ellipsis icon ( …) next to the filter to open a multi-select box.
Follow these steps:
- Select one or more desired filter values from the list of available values in the right hand list of the selection box. Move the selected filter values from the right hand list to the left using .
- To filter by all possible values, click Move All to move all values into the Selected list.
- To remove a filter value from the Selected list, select the filter value and click Move. To remove all values from the Selected list click Move All.
- If the list of possible values for use as filters is lengthy then you can narrow the list by using the Match filter drop-down to bring back a subset of values to be displayed in the right hand list.
- Once you are satisfied with your selection of additional filters, click OKto save these as searchable values or click Cancelto cancel your selections.
- Once you have finished selecting any additional filters you would like to apply. Click Go. The scatter graph and the report statistics refreshes to show the result of applying the additional filters.
Modifying Axis Selections
Thescatter graph is dependent on the values selected in the Axis drop-downs. Values in the Axis selection drop-downs represent bindings that are calculated for a scenario during the detection process and are specific to the scenario that has been selected in the Initial Filters section. These bindings often represent the values that are compared to the scenario's threshold parameters in order to determine whether or not to trigger an alert. For example, if a scenario has a threshold parameter for Minimum Total Transaction Amount, the value calculated and captured in the binding Tot Trans Amt is what is compared to the threshold value. Selecting Tot Trans Amt for use on an axis allows you to graphically plot the actual total transaction amounts that met or exceeded the scenario's Minimum Total Transaction Amount threshold. Additionally, axis selections may represent bindings that are calculated and captured for the purpose of providing parameters for use in setting up scoring rules. Being able to specify a scoring variable for a graph axis allows you to see what bindings might be useful for establishing scoring rules, based upon where on the axis the productive versus non-productive alerts fall. Being able to select and graphically display two different variables will allow you to experiment with combinations of bindings to get an understanding of how to effectively set your thresholds to work together to eliminate false positive alerts.


