9.7 Recommending Thresholds
This section describes the recommended thresholds.
Once a population of transaction aggregates have been generated, we can recommend thresholds.
- Calculate Percentiles: After removing the outliers, the
cleansed data is analyzed to determine the thresholds within each segment as
defined by the scenario logic. Suspicious activity is usually associated with
higher values and is therefore expected to be found within the right tail of the
distribution. The values corresponding to the right tail are identified by
computing the percentiles of the data values within the distribution. For this
purpose, 85th percentile is recommended as the base percentile below which the
data is assumed to be within acceptable limits and not suspicious. The choice of
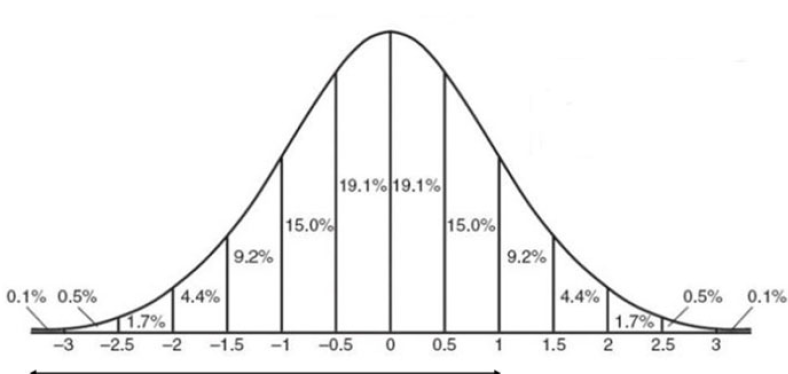
85th percentile is based on the distribution statistics of a normal
distribution, where 85% of the data lies within Mean + 1 standard deviation. The
base percentile can be customized to suit the user's preferences.
- Compute Jumps: Jumps can be defined as relative differences
(deviations) between two consecutive data points that are sorted in ascending
order. A conservative method of setting thresholds is to select values just
prior to significant increases in values observed in the data. This is because
larger jumps indicate a departure in behavior from entities at lower
percentiles, which warrants enhanced scrutiny. By utilizing jumps, recommended
thresholds can be conservatively and dynamically established based on observed
variations in the actual data distribution, rather than adopting a more static
"one size fits all" approach (see Option 3 (Using Percentiles)). Jumps
and corresponding peaks can be computed as follows for each scenario, segment
(excluding risk levels), calibratable parameter:
- For Amount or Continuous parameters: Calculate
percentile boundary values at 0.1 incremental within a band. For
Example:Jump and Slope at 95th percentile (p95.0) is calculated
as:
- Jump (p95.0) = (p95.1 – p95.0) / p95.0
- Slope (p95.0) = J95.1 – J95.0
- Peak = positive slope followed by negative slope For Count or Discrete parameters: Calculate cumulative frequency distribution for count value as X, and total frequency across all count values as Y. OFS Compliance Studio ML4AML Use Case Guide | 321 Jump (Cur) = (Xnext/Y – Xcur/Y) / Xcur/Y Slope (Cur) = Jnext – Jcur Peak = positive slope followed by negative slope
- For Amount or Continuous parameters: Calculate
percentile boundary values at 0.1 incremental within a band. For
Example:Jump and Slope at 95th percentile (p95.0) is calculated
as:
- Identify Thresholds: Option 1 (Using Jump and multiple
bands) - Assuming the base percentile to be 85th (default) percentile
(p85), the data may need to be stratified by risk depending on the scenario.
This stratification is done based on the overall risk level that can take any of
the following three values: High Risk (HR), Medium Risk (MR) and Regular Risk
(RR). A risk boundary represents a conservative yet acceptable range of
threshold values for a given segment. The percentile risk boundaries
(configurable by the user) for the three risk levels can be defined as:
- HR: p85 – p90
- MR: p90 – p95
- RR: p95 – p99.9
Determining threshold values within a given risk boundary (band) provides an opportunity to identify anomalies within each risk level and helps set thresholds in way to provide more conservative (lower thresholds) coverage for HR activity relative to MR activity and RR activity. The threshold values corresponding to the risk levels can be identified by the highest peaks within the respective percentile bands.
Option 2 (Using Jump and single band) - This approach can be used as an alternative to Option-1 by considering only one single percentile band and identifying 3 highest peaks within the chosen boundary values. Assuming the base to be 85th percentile, identify 3 highest peaks, P1, P2, P3 between p85-p99.9 and assign them as thresholds for HR, MR, and RR risk levels respectively.Note:
If 3 peaks cannot be found or population size is low (for ex: <1000), options are provided to determine threshold using various options (share a peak, borrow a threshold from neighbor segment, or default percentile).Option 3 (Using Percentiles) - Assuming the base percentile to be 85th percentile, the thresholds can be directly set at 85th, 90th and 95th percentiles (configurable by the user) for HR, MR, and RR risk levels respectively. In this case no other calculations would be necessary other than the percentiles.
