9.6.3.2 Creating a Notebook for Your Financial Crime Discovery

This topic describes the systematic instructions to create a notebook or model.

The first step in any scenario is to create a notebook or model. In this use case, you can create a notebook to discover your financial crime.

To create a new notebook, follow these steps:
  1. Create a Notebook and specify the notebook details.
  2. After the notebook is created, create a Paragraph using the PGX Interpreter.

    Figure 9-27 Create Paragraph using the PGX Interpreter


    In this example, the PGX Interpreter is used to create a PGX query to load the graph. You must specify the session information that you want to retrieve the data. The query is executed, and the graph details such as graph name, edges, nodes, or vertices are displayed. Further, to understand pattern detection, you must understand the node details, vertices, and edges within the displayed data.
  3. For instance, you can specify the matrices, such as the vertices and edges that exist within the data.

    Figure 9-28 Specify the Matrices


    In this example, the parameters included are:
    • SELECT: The code v.entity,v.jrsdcn, count(*),max(v.rishnb) from g, fetches the jurisdiction count and risk numbers within the graph g, which is built from the previous paragraph.
    • MATCH: Matching the vertices.
    • GROUP BY: Grouping the entities by vertices and jurisdiction.
  4. Click Execute Paragraph. The entities' data, such as the jurisdiction, country, and risk numbers, are displayed.
  5. You can click the Data Visualization icons within the paragraph to view the details in the visual form to make it more consumable for you.
  6. You can hide the code and add a title to the data fetched to make it presentable, consumable, and sharable with others.
    The visualizations displayed are easy to consume, allowing you the flexibility to choose the type of visual. The visualization, in this case, is a Pie Chart, which enables you to see the entities associated by their type based on the percentage. You can use the other visualization option to see various types of visuals and different visualization formats.
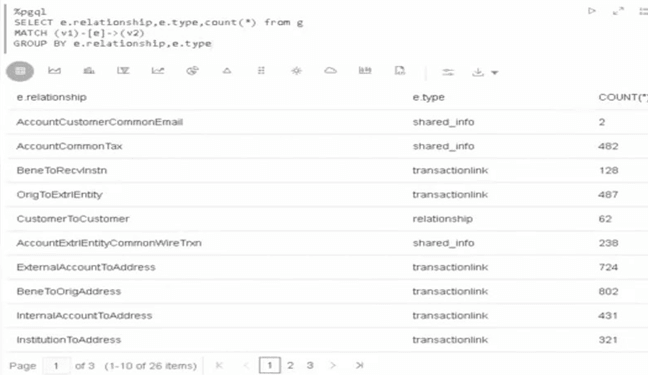
  7. After the first level execution, execute further to understand the relationships that exist between the edges by writing the relationship query.
    For example, the parameters included are:
    • SELECT: The code e.relationship,e.type,count(*)from g fetches the relationship count within the graph g, which is built from the first paragraph.
    • MATCH: Matching the vertices "v1" and "v2" and the edge is "e". You must write the vertices within parenthesis and edges within brackets to fetch the PGQL query.
    • GROUP BY: Grouping the entities by relationship and type.
  8. Click Execute Paragraph. The entities' data, such as the jurisdiction, country, and risk numbers, are displayed.
  9. You can click the Data Visualization icons within the paragraph to view the details in the visual form to make it more consumable for you. Each paragraph executed is a rest service that allows you to execute based on the updated service. You can hide the code and add a title to the data that is fetched to make it presentable, consumable, and sharable with others.