9.6.4 Highlighting the Nodes and Edges of the Graph
The Nodes and Edges in your graphs can be customized to visualize the data flow between the entities better.
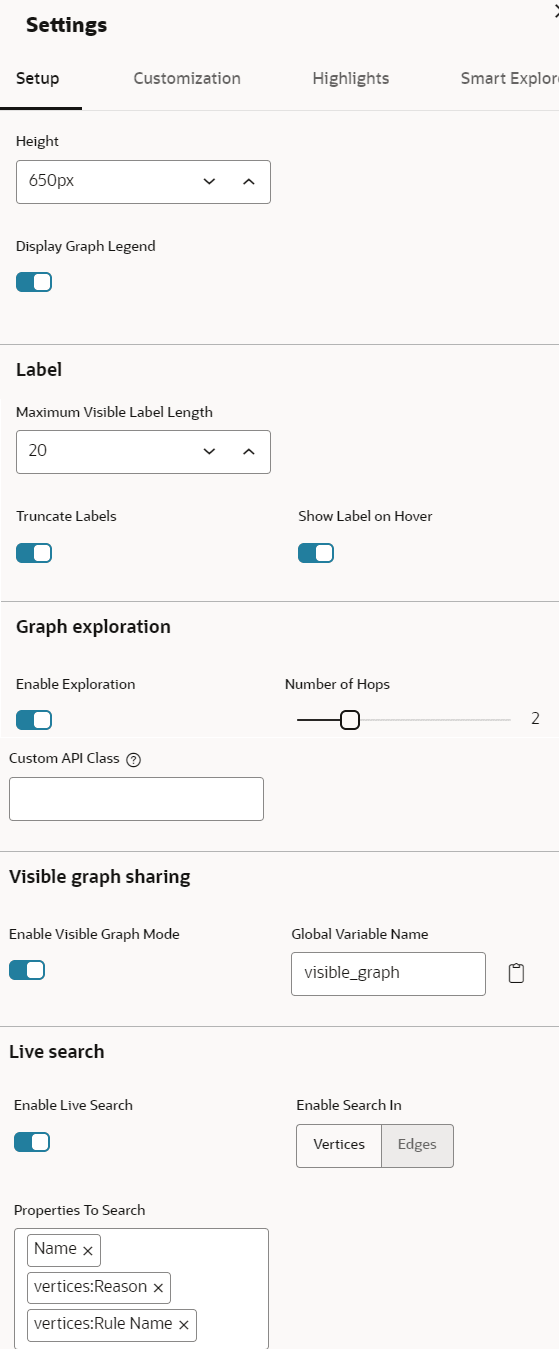
To customize the Nodes and Edges, you can navigate to the graph setting and add new highlights in the Highlights tab.
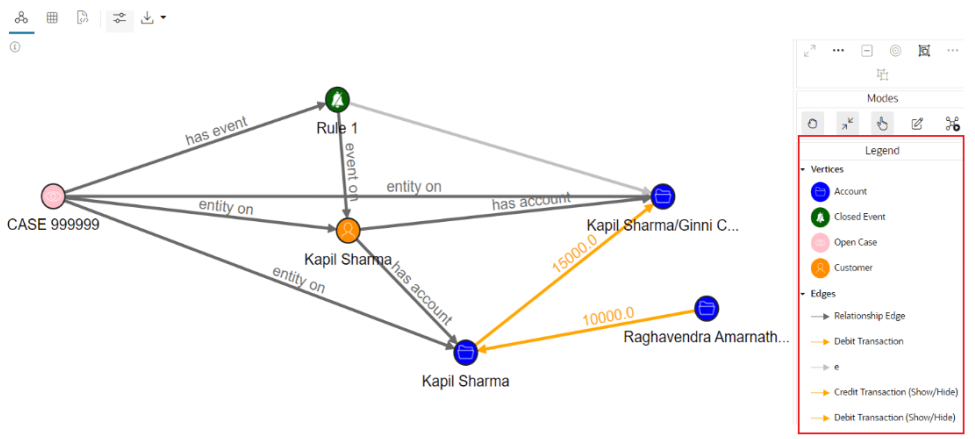
Vertices
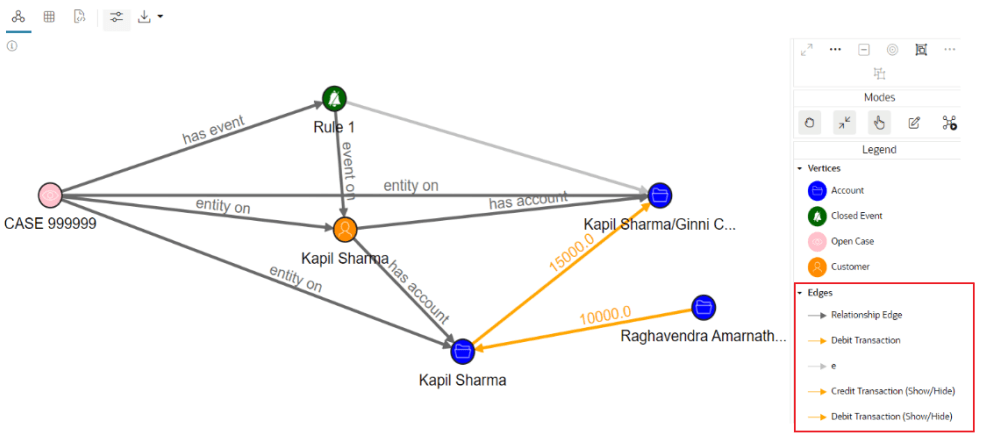
Edges
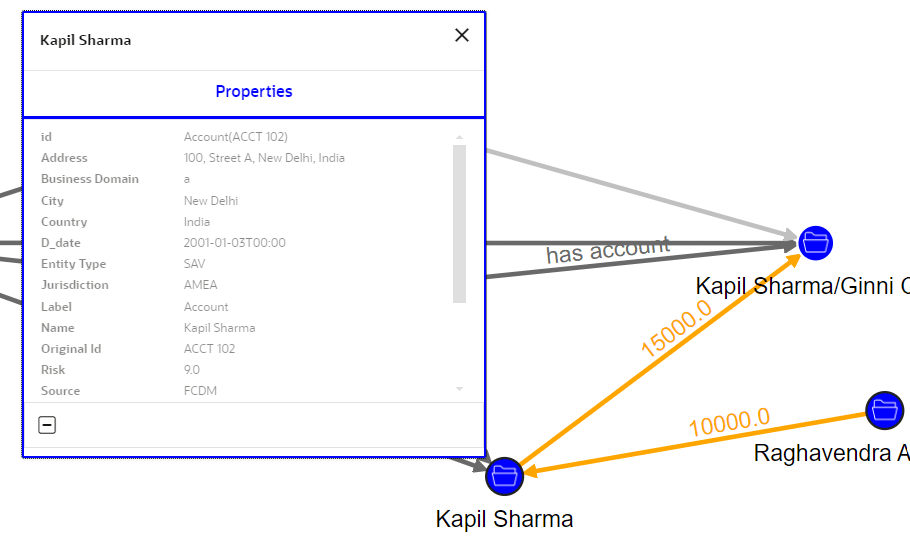
The graphs illustrate a pattern, where there is a money flow from the bank to the different accounts from a customer, with the flow of money highlighted with different colors. Blue represents the money flow from the account to the bank, and red represents the money flow from the bank to the account.
By exploring the options available within the graph customization, you can streamline your analysis and present your reports based on your use case.


