9.1 Compliance Studio Global Graph
Compliance Studio provides a pre-defined Financial Crime graph that can be pre-loaded for most Financial Crime use cases, including Investigation Toolkit.
It also provides an intuitive way for creating graphs used in notebooks, where you can load graphs from external sources or create custom graphs. Compliance Studio includes the PGX, a fast, parallel, in-memory graph analytic framework developed by Oracle. Using PGX, you can load multiple graphs into a notebook and create PGQL queries against different graphs. The result obtained from running a paragraph in a notebook can be used as input to other paragraphs in the notebook. The results of analytics algorithms are stored as the graph's nodes and edges properties. Pattern matching can then be used against these properties.
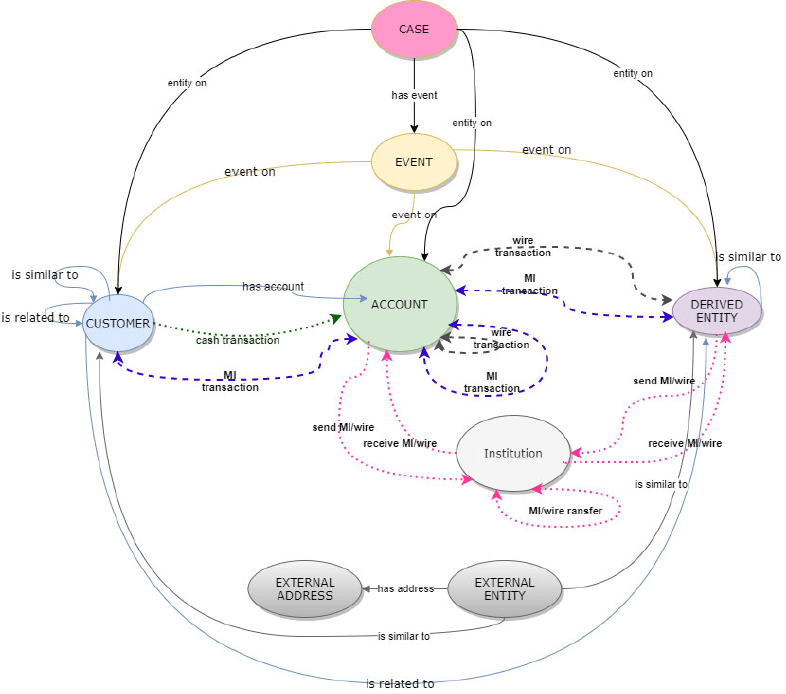
The Financial Crime Graph is created by an ETL process that brings in data from our Financial Crime Data Model and freely available data from the International Consortium of Investigative Journalists by default but can be easily configured to include other data sources. As part of the ETL process, matching is run on nodes within the graph and creates similarity edges that link nodes based on name, address, and other attributes.
ETL can be run through graph pipelines, for more information see Graphs section.
Figure 9-1 Oracle Financial Crime Graph Model
Note:
The Case node in this Financial Crime Graph Model is loaded only when loading the FCDM data from Enterprise Case Management (ECM). The graph includes “CASE” nodes and “has event” edges when data is loaded from ECM.
