8.1.1.2.3 Custom results data view
User can create new visualization reports to view data for specific
attributes of results entities. Steps to view custom source data in Data View UI are as
below.
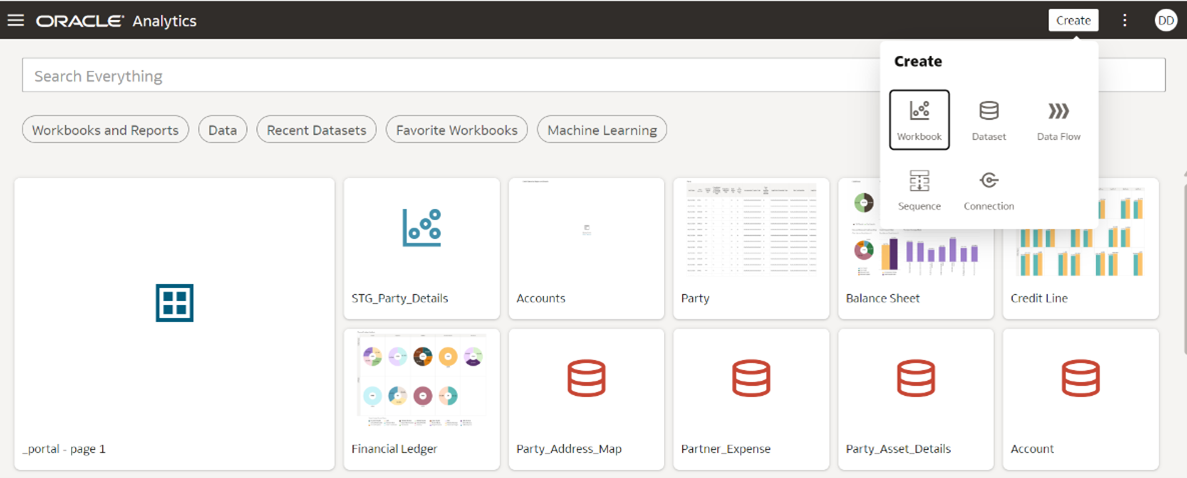
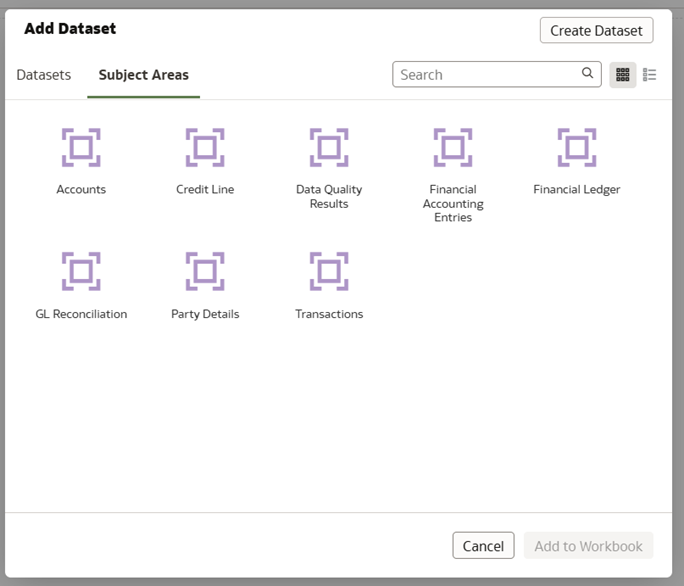
- Top Right Corner -> Create -> Workbook -> Subject Area -> Choose
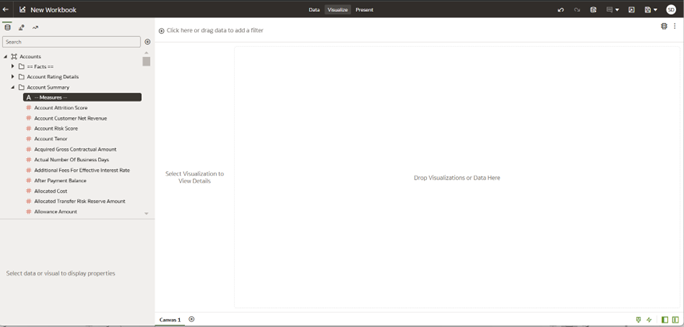
Subject Area -> (new Workbook is created)
Figure 8-15 Custom results data view

Figure 8-16 Add Dataset

Figure 8-17 New Workbook
 Each workbook can have multiple Canvases, similar to the way excel workbook has multiple sheets.
Each Canvas can have multiple visualizations, similar to the way single excel sheet can have multiple graphs in single sheet. Maximum of 6 visualization is recommended in a single canvas for optimum system performance.
User can drag and drop attributes required for analysis from left hand side (LHS) under data button. This process is very user-friendly and doesn’t require the abilities of SQL query writing to fetch data.Figure 8-18 Data button
 Attributes are displayed in data tab in following order:
- Fact entities in alphabetical order based on Entity logical name
- Dimension entities based on alphabetical order
- Attributes displayed in alphabetical order within fact and dimension entities
- ‘My Calculations’ on left bottom will display any calculation formulae added by user
Users can add calculation formula for value measures displayed in the view.
Users can also save and share these custom report created with other users.