8.1.1.3.2 GL Summary
Financial Ledger pre-built report is based on subject area by the same name. It provides stakeholders with an overall summary of institutions’ Chart of Accounts (CoA) as of the selected date.
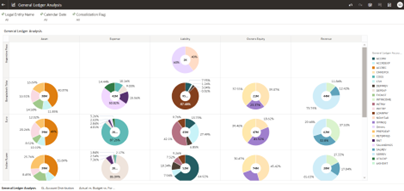
General Ledger Analysis and GL Account Distribution
The first two dashboards feature a series of donut visualizations that display the 5 main CoA categories such as Assets, Expenses, Liabilities, Owner’s Equity, and Revenue. Each CoA category has separate donut view for every currency where bank has exposure. The donut shows breakdown for the CoA by the types of General Ledger (GL) data for each currency.
For example: For CoA of Assets, banks may have data spread across various currencies. Donut will show view for Assets spread across their natural currencies by various GL types (means asset types here) like Cash, Inventory, Fixed Assets, and so on.
Figure 8-41 General Ledger Analysis

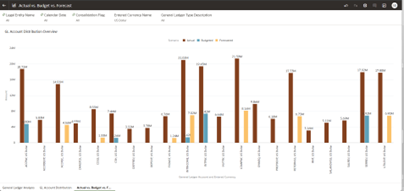
Actual vs Budget vs Forecast
The Actual vs. Budget vs. Forecast visualization provides a view of budgeted GL numbers and their comparison with actual numbers and forecasted numbers for future periods.
Figure 8-42 Actual vs Budget vs Forecast
