3 Data Quality Executions
The Data Quality Executions tab provides a detailed analysis of the execution
statistics for data quality checks, offering valuable insights into the efficiency and
performance of these processes. It is designed to help users evaluate the effectiveness
of data quality checks and track rejection patterns over time.
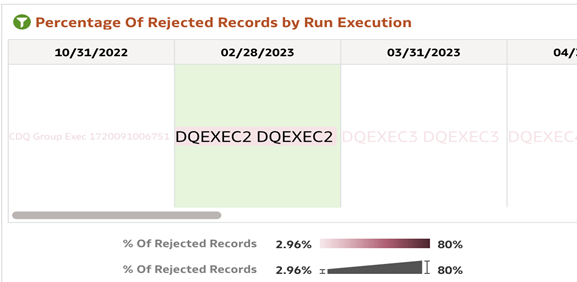
- Percentage of Rejected Records: Percentage of Rejected Records by Run Execution is determined by the ratio of No of error records to No of scanned records grouped by Run Description, Run Execution Identifier across execution dates.
- Activity - Results Data Browsing
- Objective: To analyze and monitor the percentage of rejected records categorized by run descriptions and execution identifiers over specified dates.
- Persona: Business Analyst
| Step Description | Observations |
|---|---|
| Follow the navigation path: Home → Catalog → Shared Folders → Data Quality Visualization à Data Quality à Data Quality Executions |
|
- Total Scan Count by Entity: Displays the total number of scanned records for each source table, categorized by entity, with the most recent value highlighted.
- Total Scan Count by As of Date: Shows the total number of scanned records by execution dates, categorized across these dates, with the latest value displayed.
- Total Records Failed by Entity: Represents the total number of failed records for each source table. This tile features a line chart categorized by entities, showcasing the most recent value.
- Total Records Failed by As of Date: Highlights the total number of failed records categorized by execution dates. A line chart displays the most recent value.
- Activity - Results Data Browsing
- Objective: to provide a detailed analysis of scanned and failed records across entities and execution dates, enabling users to monitor data quality trends, identify problematic entities, and track performance over time for effective issue resolution and process improvement.
- Persona:Business Analyst
| Step Description | Observations |
|---|---|
| Follow the navigation path: Home → Catalog → Shared Folders → Data Quality Visualization à Data Quality à Data Quality Executions | Based on the filter criteria set, the chart is shown as
below
Figure 4-2 Activity - Results Data Browsing  |
- Execution Results: This table presents metrics including the number of failed records, the number of scanned records, and the percentage of rejected records associated with a specific execution date, entity, attribute, check code, and check description.
- Activity - Results Data Browsing
- Objective: to provide a detailed tabular report on the execution results
- Persona: Business Analyst
| Step Description | Observations |
|---|---|
| Follow the navigation path: Home → Catalog → Shared Folders → Data Quality Visualization à Data Quality à Data Quality Executions | Based on the filter criteria set, the chart is shown as
below
Figure 4-3 Execution Results  |
