3.3.4 DFCS Data Governance Analyst User Interface
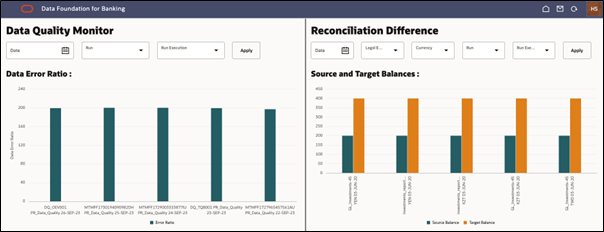
Upon logging into the DFCS application, a Data Governance / Data Control User is presented with a dashboard displaying key data quality and reconciliation metrics through sample graphs.
Landing Page Components:
- Data Quality Monitor (DQ Monitor):
- Displays two graphs:
- Data Error Ratio
- Number of Records Failed vs. Scanned
- Clicking on the DQ Monitor graph redirects the user to the Data Visualization Report for DQ Monitor.
- A "Refresh Data" button at the top right corner allows users to update the displayed data.
- Displays two graphs:
- Reconciliation Difference:
- Displays two graphs:
- Source and Target Balances
- Negative and Positive Absolute Differences
- Clicking on the Reconciliation Difference graph redirects the user to the Data Visualization Report for Reconciliation Difference.
- A Refresh Data button at the top right corner allows users to update the displayed data.
Figure 3-1 DFCS Data Governance Analyst User Interface

- Displays two graphs: