8.3 Use Case Analysis
The Use Case Analysis is a pre-built, out-of-the-box report
designed to support customers who choose to onboard multiple applications in a sequence.
In this context, each application represents a distinct use case. The report provides
customers with a clear view of how many additional data elements would be required to
onboard subsequent applications after starting with one. It also highlights the total
number of data attributes used by each application, the number of common attributes
shared across applications, and the additional attributes unique to each application.
This helps customers plan and manage their data onboarding process more efficiently.
To access DQ dashboards:
8.3 Use Case Analysis Window
Here’s a breakdown of the main items available in the Use Case
Analysis window. On the Visualize window, the following canvas are available
in the Use Case Analysis report:
- Summary – Overview of all use cases and attributes.
- Use Case Details – In-depth details for each use case.
- Use Case Comparison – Side-by-side comparison of use cases.
- Attribute Details – Breakdown of attributes within each use case.
8.3 Summary
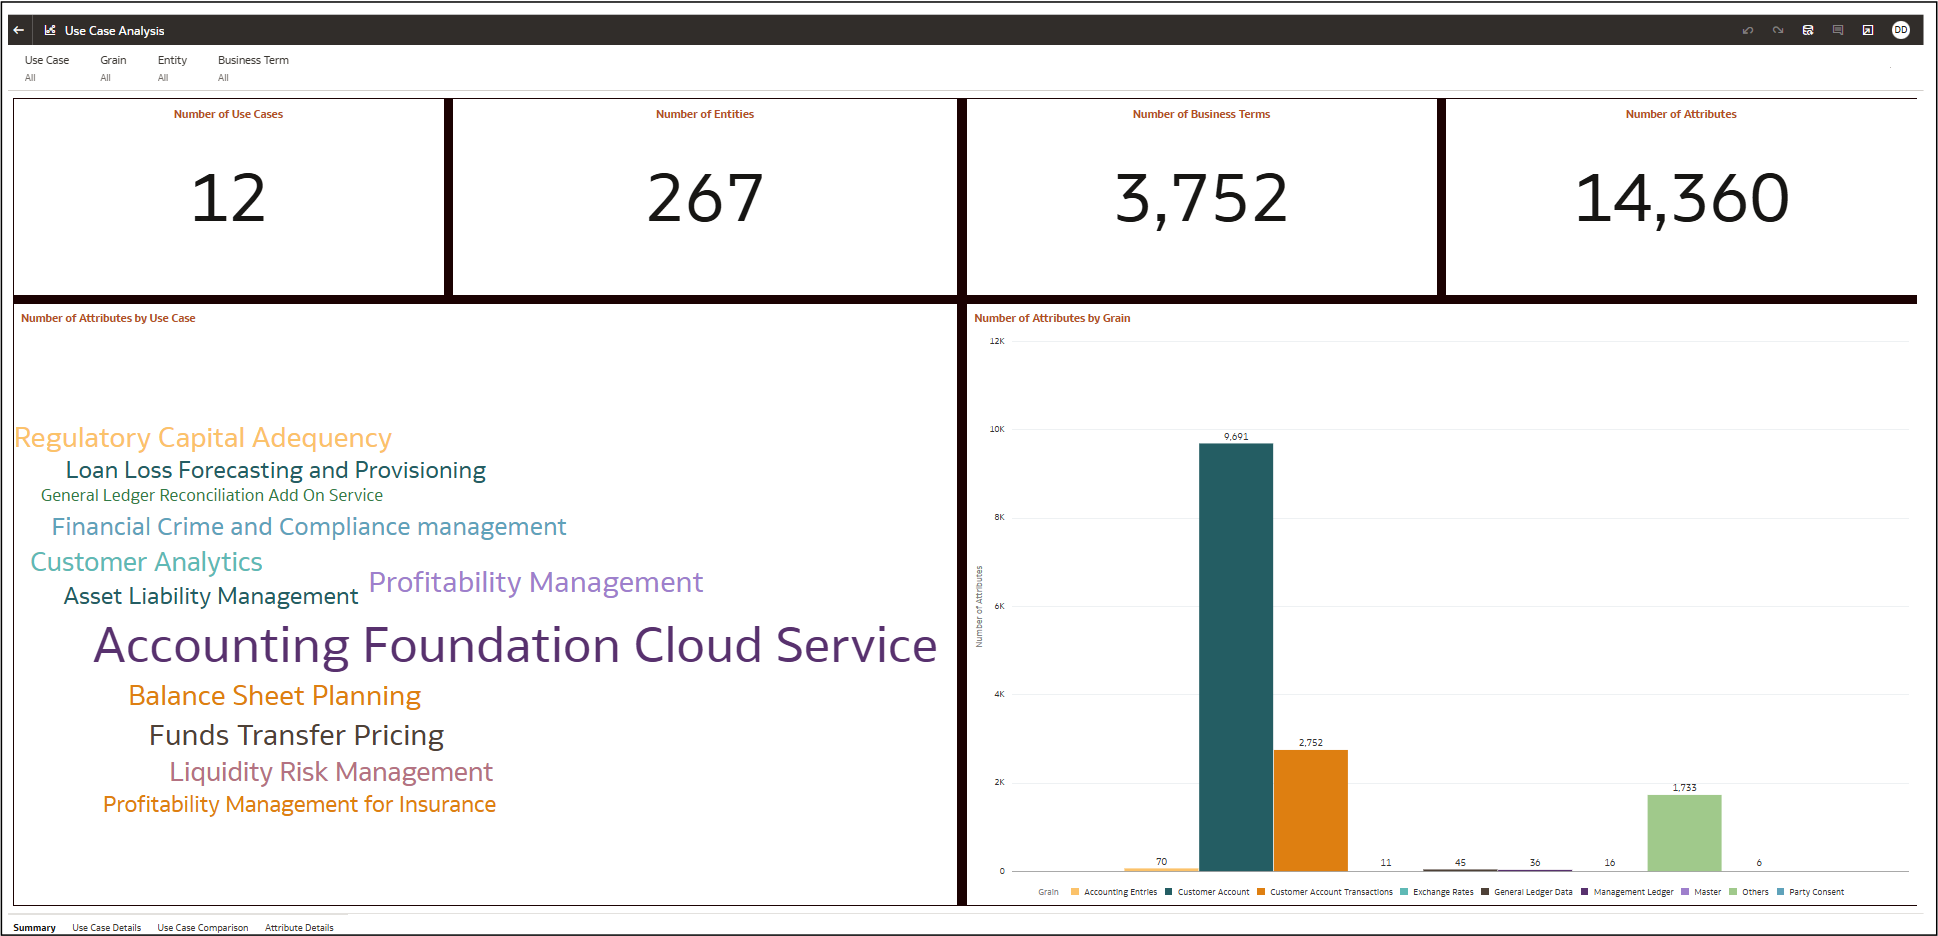
The Summary section provides an overview of how to use the tool effectively,
including how to assess additional elements required for integration with other
financial products.
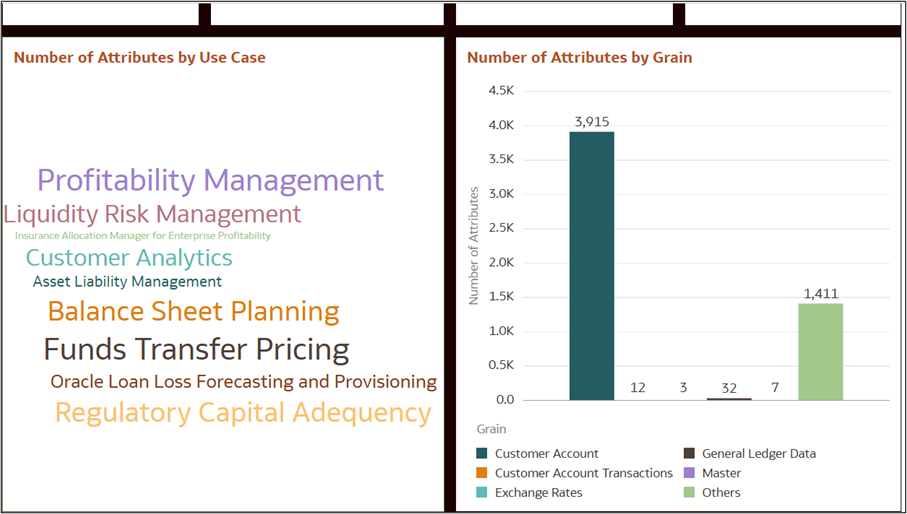
Figure 8-97 Summary Window

- Determine the impact of additional financial products.
- Identify missing elements needed for full integration.
- Understand table relationships between different applications.
- Percentage-Wise Requirement AnalysisIdentifies percentage gaps (e.g., a customer needs to bring in the remaining 25%).
- Helps determine which additional datasets, calculations, or reports are necessary for complete functionality.
- Balance Sheet & Customer Data IntegrationEvaluates which balance sheet elements must be incorporated.
- Assesses customer data integration requirements for analytics and compliance.
8.3 Use Case Details
The Use Case Details section provides an overview on how to analyze entity
usage across various use cases in financial or business management.
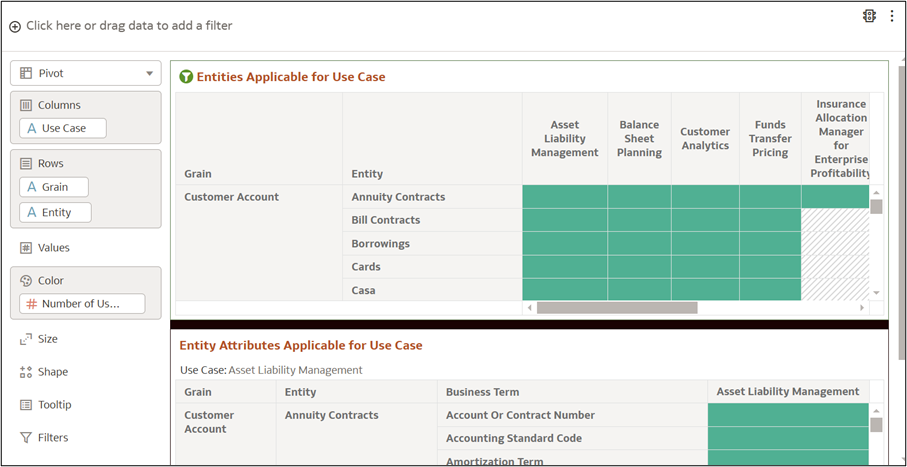
Figure 8-98 Use Case Details

- Check the percentage indicator to see what portion of the required data is already available.
- Review the missing components and determine what additional elements must be integrated.
8.3 Use Case Comparison
This section provides an overview on how to compare attributes across different
financial/business use cases. It displays percentage coverage of attributes between
the reference use case and comparative use case.
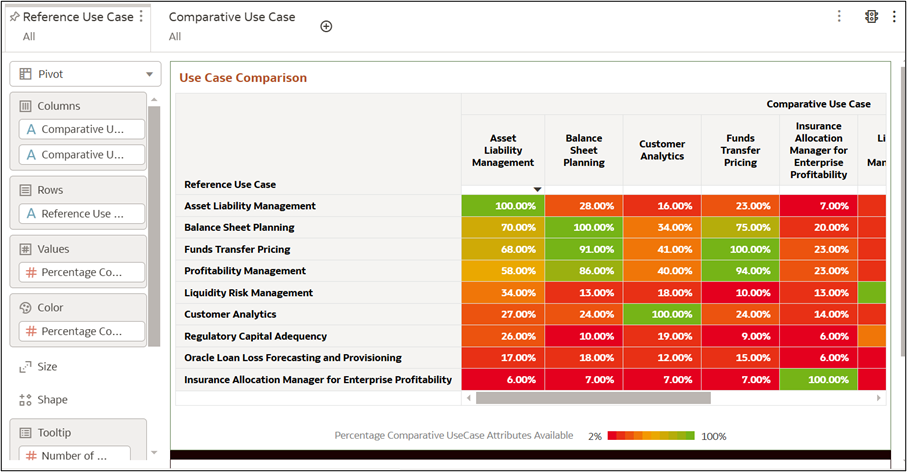
Figure 8-99 Use Case Comparison

- Reference Use Case: Acts as a benchmark for evaluating other use cases.
- Comparative Use Case: The use case that is directly compared to the Reference Use Case.
- Number of Common Attributes: The count of shared Entity.Attributes between the Reference and Comparative Use Cases.
- Number of Additional Attributes Required: The count of extra Entity.Attributes needed for the Comparative Use Case that are not included in the Reference Use Case.
- % of Comparative Use Case Attributes Available in Reference: The percentage of attributes from the Comparative Use Case that are present in the Reference Use Case.
Example
The pop-up tooltip (hovered over any entity)
provides:
- Number of attributes in the Reference Use Case (1,210).
- Number of attributes in the Comparative Use Case (1,881).
- Number of Common Attributes (194).
- Number of Additional Attributes Required (1,687).
- Percentage of Comparative Use Case Attributes available in the Reference Use Case (10%).
- Insights:
- High percentages (green areas) indicate a strong overlap of attributes between reference and comparative use cases.
- Low percentages (red areas) suggest gaps or differences between the datasets.
- Some cells show 100% coverage (e.g., "Funds Transfer Pricing"), meaning the attributes completely match between the two use cases.
8.3 Attribute Details
Attributes Details report within a Use Case Analysis dashboard is structured as
a data table showing attributes related to financial or business processes.
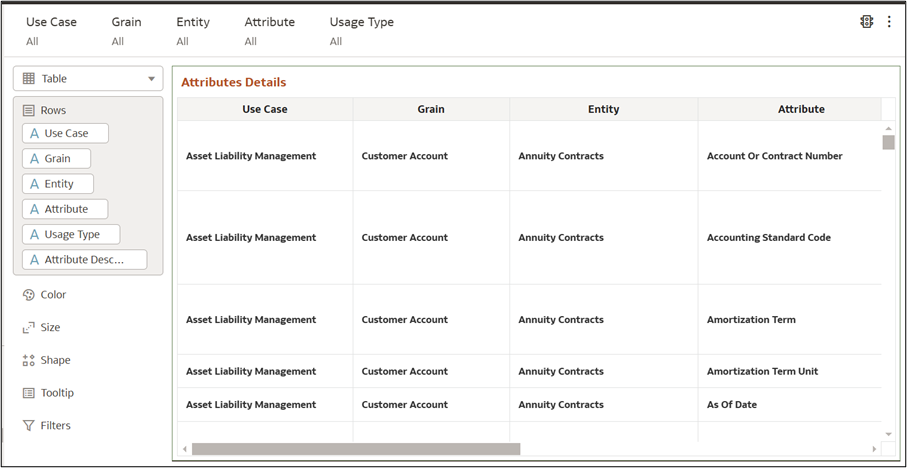
Figure 8-100 Attribute Details

The interface consists of two main sections:
Data Table (Attributes Details) – Displays key dataset details:- Use Case – Business process or scenario
- Grain – Level of data detail
- Entity – Business data objects
- Attribute – Specific data fields (e.g., "Account or Contract Number")
- Usage Type – Classification of attributes (e.g., "Mandatory" means required)
