8.2.2.2 Custom results data view
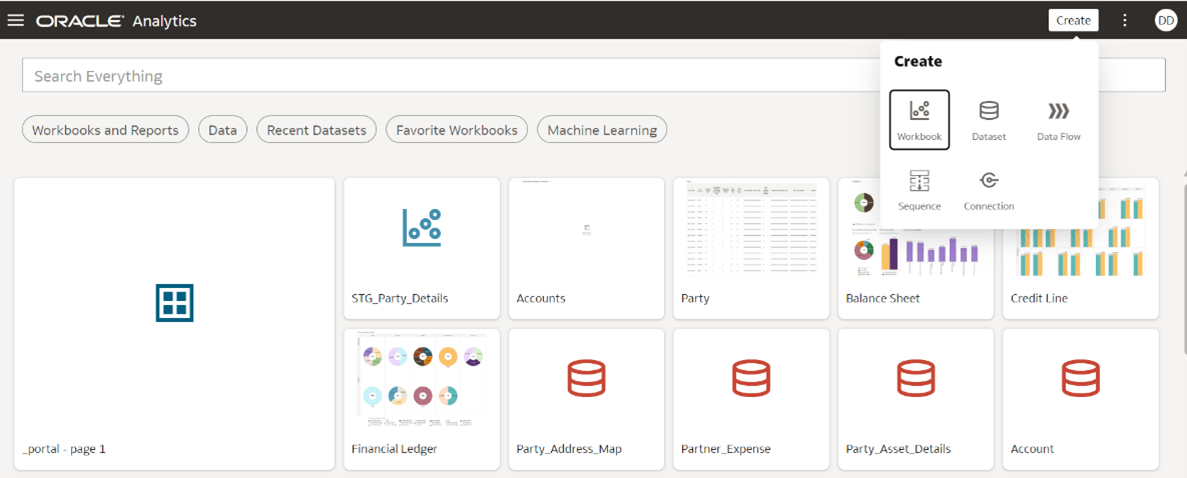
- Navigate to the Oracle Analytics home page.
- On the top right corner click Create →
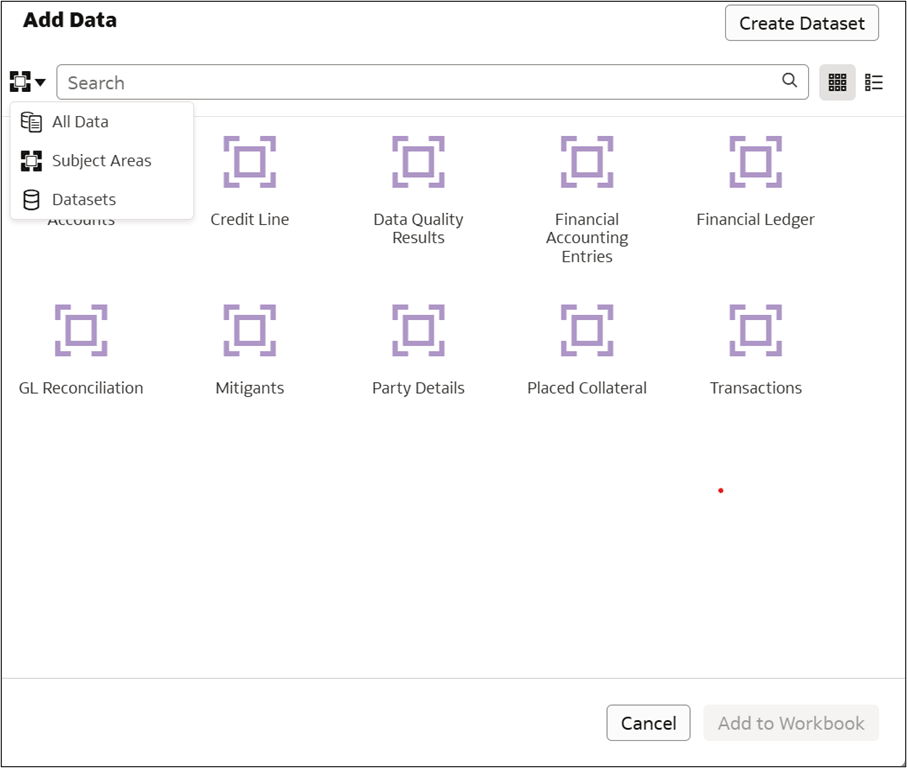
Workbook . The Add Data pop-up screen
appears.
Figure 8-23 Custom results data view

Figure 8-24 Adding New Data

- From the Select Data drop down, select
Subject Area → Choose Subject
Area → Add to Workbook.
Note:
Each workbook can have multiple Canvases, similar to the way excel workbook has multiple sheets.Each Canvas can have multiple visualizations, similar to the way single excel sheet can have multiple graphs in single sheet. Maximum of 6 visualization is recommended in a single canvas for optimum system performance.
User can drag and drop attributes required for analysis from left hand side (LHS) under data button. This process is very user-friendly and doesn’t require the abilities of SQL query writing to fetch data.
Add and manage datasets
Inspect and explore data tables
Join multiple datasets together for analysis
Create custom fields or visuals based on the data
Figure 8-25 Data button
 Attributes are displayed in data tab in following order:
- Fact entities in alphabetical order based on Entity logical name
- Dimension entities based on alphabetical order
- Attributes displayed in alphabetical order within fact and dimension entities
- ‘My Calculations’ on left bottom will display any calculation formula added by user
Note:
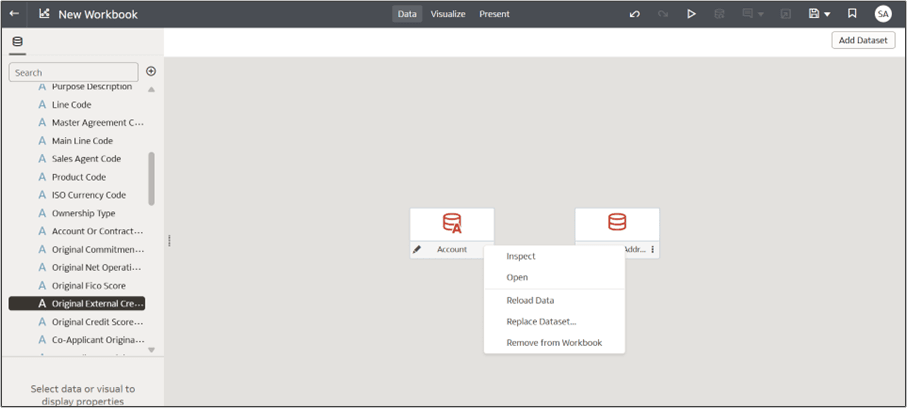
Users can view the following on the canvas.- Shows datasets as tables (e.g., "Account" and "Address").
- You can drag and drop to create joins between datasets (not yet connected in the screenshot).
- Right-clicking on a dataset brings up the following options.
- Inspect – Opens a preview of the dataset including data types, column samples, and row count.
- Open – Opens the dataset in full for editing or creating calculated fields.
- Reload Data – Refreshes the data from the original source.
- Replace Dataset – Swap the dataset with a different one while maintaining visuals (if compatible).
- Remove from Workbook – Deletes the dataset from the
current workbook.
Figure 8-26 Adding and Replacing a Dataset

- Click Add Dataset (top-right) to include additional data sources.
- Click on the + icon to add Datasets to selected Subject Area.
- Select Datasets from the Add Data drop down.
- Select the required Dataset and click Add to
Workbook. For more information, see Adding Dataset
section.
Note:
Matching is not allowed as each one has already been matched to a different Subject Area. - Click Save (top-right) to save the workbook.
Figure 8-27 Saving a Dataset
