8.2.3 Data Visualization via Custom Datasets
In the previous sections, the guide covered source data visualization and results data visualization using out-of-the-box (pre-packaged) datasets and subject areas. This section includes the steps needed to build a custom dataset for visualization of result data (or stage and dimension data), for entities that are not packaged in out of the box subject areas or datasets. Post custom dataset creation, users can use the custom created dataset for data visualization via workbook creation.
While DFCS contains pre-seeded datasets – which are called results Subject Areas like Accounts or Transactions, creating your own dataset lets you visualize any entities not included out of the box. Custom dataset can also be used to visualize data loaded and processed for custom entities and attributes.
Building a custom dataset allows you to define exactly which fact and dimension entities to join, how they are joined, and which attributes to include in the view. Once created, this dataset is ready for visualizing the results data.
- Log in to the DFCS application and go to Data Visualization screen (Oracle Analytics).
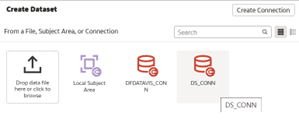
- From the home page, in the top-right corner click Create > Dataset
and then pick the appropriate connection.
Figure 8-31 Custom Dataset

Figure 8-32 Create Dataset
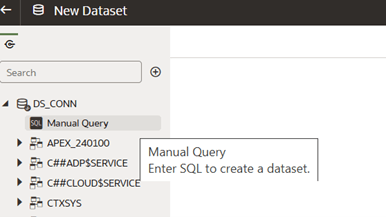
- On the New Dataset screen, select the appropriate schema. Scroll through the
list or use the search bar to find the tables you need, select, drag and drop
them to the right-hand side join diagram section.
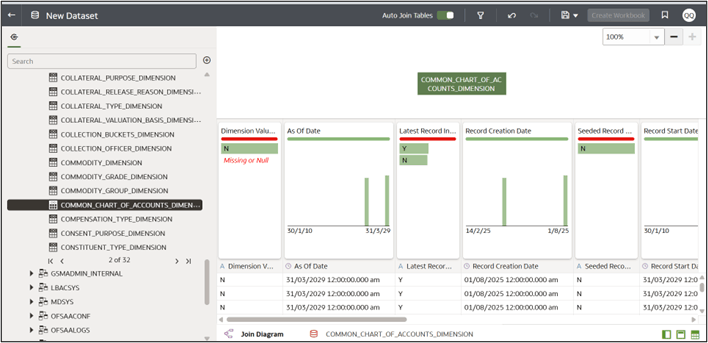
By default, Oracle Analytics will auto-create joins, if you prefer to define them yourself, toggle Auto Join Tables off.
Note:
Always drag the fact table in first - positioned at the left - and then bring in each dimension table you need on top of this fact table, with which you want to create the join. For example, we can drag in the Fact Common Account Summary table and the Account Dimension table.Figure 8-33 New Dataset
- Configure the join between the selected tables. To do this, click the Join icon
and configure the join. Select the type of join you want. Click outside and
watch for the join icon to turn from red to green - green denotes your join is
successful.
Figure 8-34 Custom Dataset Visualization
- With your tables linked, click Edit Definition on each table to select only the
columns your reports require. You can do this by dragging and dropping the
required columns.
Figure 8-35 Edit Custom Dataset Visualization
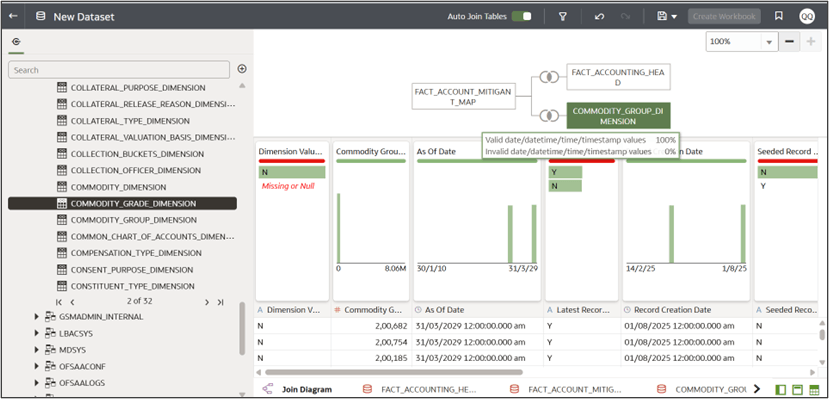
Figure 8-36 Edit Custom Dataset Visualization_2
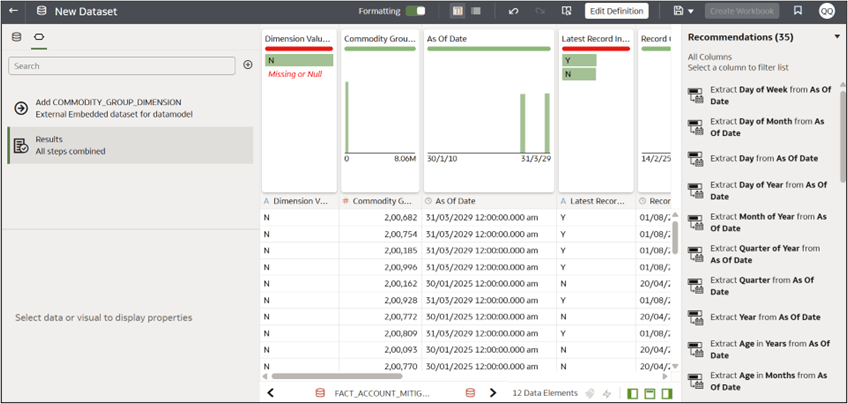
- To ensure consistent data load, change the data access for the table from automatic caching to “Live”.
- Save the dataset. To reopen ii, navigate to Oracle analytics, select hamburger menu > data > datasets > click the three dots in the Actions menu corresponding to the custom dataset, and select open. Now, navigate to the edit definition window for the table to see section to configure data access on the right-hand side. Set it to live.
- Refresh the profile by clicking on the Profile Refresh icon – (next to the Save button on top). Then press Save
- Adjust the data types manually, if needed. By default, every column is set to Text. Click the metadata icon at the top and change numeric measures - like End-of-Period Balance - from Text to Number. Change Treat As to Measure. This step allows Oracle Analytics to perform aggregations correctly. Perform this step for all numeric fields as needed.
- Once required columns have been added and their Datatypes updated, click
Save to store the dataset. This saved Custom Dataset can be used for
data viewing and analysis by clicking Create Workbook in the
top-right.
There is also an alternative approach to preparing data using Manual SQL Queries in the dataset.
After selecting the relevant schema, User can drag the Add Manual Query option onto the diagram pane, click edit definition, search for the required tables and columns to build manual query. While writing the query ensure, that you use Logical column name in double quotes, use schema name before entering table name. Table name is Logical table name with space replaced with underscore.Note:
Anything inside double quotes is case-sensitive – and you must use the logical column names correctly. - Click Refresh & Preview to validate your results, then save the dataset. Name the dataset on top left corner and click Save.
To create visualizations using the dataset that has just been created:
- Click Create -> workbook
- Select dataset, search for newly created custom dataset -> Add to workbook
- In the workbook, drag and drop the required columns from the dataset to create the required visualizations. Change the chart type, based on your analytical need. Do calculations, if needed.