16.5.1 Current Period Report
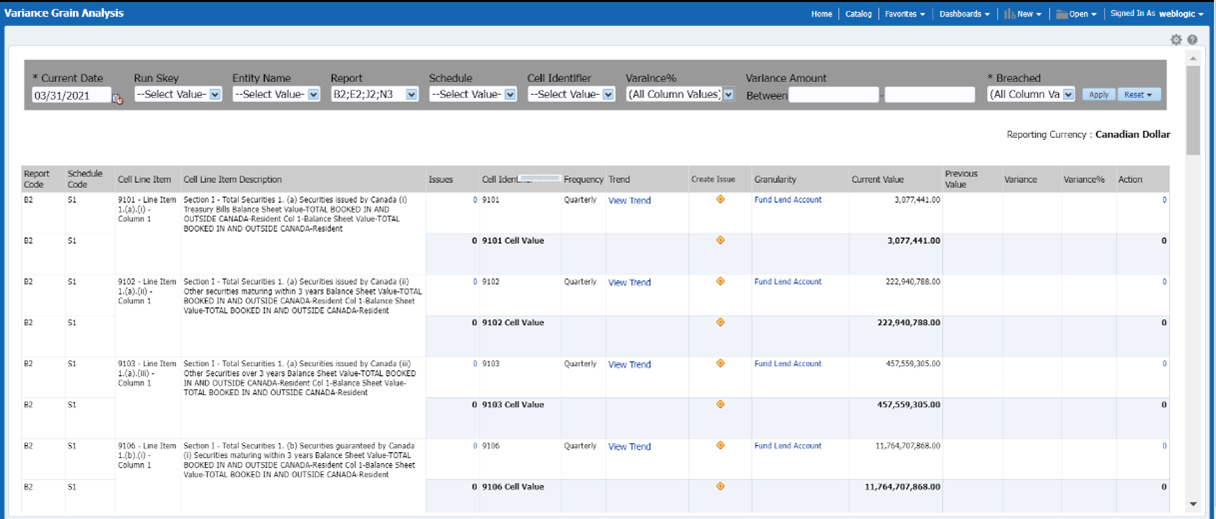
The Variance Grain Analysis Dashboard provides data based on selecting the values from the following list of drop-downs:
Note:
You must manually select the reports and then click Continue.The Variance % is calculated with the following formula:
Variance % computed = (Current Value – Previous Value)/Previous Value
- *Current Date: Select a Date on which the assessment has been done.
- RunSKey: Select the RunSkey from the drop-down list.
- Entity Name: Select an Entity Name.
- Report: Based on the KI Configuration this drop-down populates, select a Pre-configured Report.
- Schedule: Based on the KI Configuration this drop-down populates, select a schedule.
- Cell Identifier: Based on the KI Configuration this drop-down populates, select a Cell Identifier.
- Variance %: Select a variance %
- Variance Amount Between: Enter the Variance Amount Range.
- Breached: Select 'Yes' or 'No' or both.
- Ensure you have configured the Key Indicators. Refer to the Configuring Key Indicator Section.
- Click Apply to generate the reports.
- Click Reset to reset the values. The generated report
contains the following details:
- *Current Date: Select a Date on which the assessment has been done.
- RunSKey: Select the RunSkey from the drop-down list.
- Entity: The entity for which the assessment was done.
- Report Code: Provides report code of the cell.
- Schedule Code: Provides schedule code of the cell.
- Cell Identifier: Provides the MDRM code of the cell.
- Variance %: Provides the percentage value of the variance.
- Variance Amount: Provides the difference between the current and previous values.
- Breached: Select 'Yes' or 'No' or both.
Figure 16-42 Variance Grain Analysis Dashboard

- Issues: Provides the count of issues against each
cell. There is a drill-down that displays the details of the issues.
Figure 16-43 Variance Analysis – Issue Details

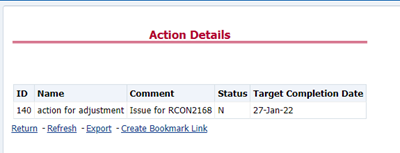
- Actions: Provides the actions taken for each issue.
The drill-down shows the action count.
Figure 16-44 Variance Analysis – Action Details

- Trend: Displays the graphical representation of the
assessment across time. You can select between:
- Trend for All Dates
- Trend for Date Range
Note:
Trend graphs can be exported to PDF and Excel.
Figure 16-45 Trend

- Create Issue: Create an issue from the dashboard itself against any cell irrespective of whether it has been breached or not. This issue can be modified on the DG Issues page. After you create an issue through this method, you can view the number of created issues in the OBI Dashboard. For more information, see section Creating an Issue through the Dashboard section.