16.1 Data Quality Dashboards
The Data Quality Rules for Dashboards must be executed through batches only and not through the DQ screen. For Data Quality refer to the OFS Data Governance Run Chart and execute the batch DGS_DQ_CTL_BATCH, Data Profile for the date on which the data quality check needs to be executed. Refer to the OFS Data Governance Run Chart for further details.
Based on the Data Quality check defined in the DQ framework of AAAI, the dashboard generates the reports. These are predefined values. The dashboard also generates the reports based on the check type the user wants to analyze the data with.
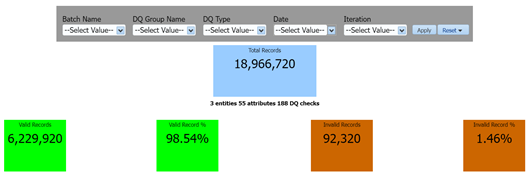
The Data Quality Dashboard homepage displays data based on selecting the desired Date and the following list of drop-downs:
- Batch Name
- DQ Group Name
- DQ Type
- Date
- Iteration
Click Apply to generate the reports.
Click Reset to reset the values.
The first grid displays the following data:
- Number of Total Records
- Number of Valid Records
- Valid Record percentage (Green shows the pass DQ %)
- Number of Invalid Records
- Invalid percentage (Red shows the failed DQ %)
- Number of entities, attributes, and DQ checks
Figure 16-1 Data Quality Dashboard
