16.5.2 Prior Period Report
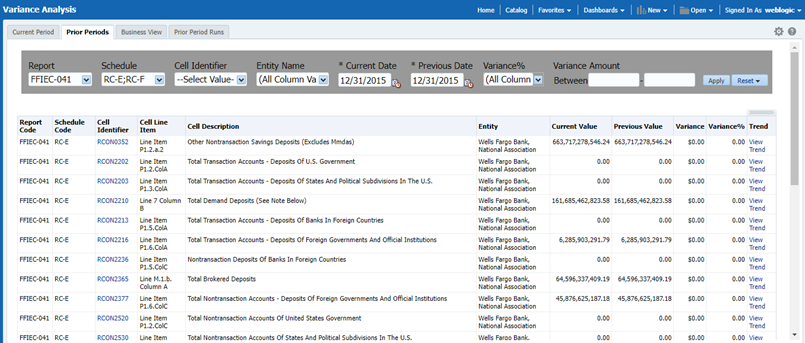
The Variance Analysis Dashboard provides data based on selecting the values from the following list of drop-downs:
Note:
You must manually select the reports and then click Continue.The Variance % is calculated with the following formula:
Variance % computed = (Current Value – Previous Value)/Previous Value
- Report: Based on the KI Configuration this drop-down populates, select a Pre-configured Report.
- Schedule: Based on the KI Configuration this drop-down populates, select a schedule.
- Cell Identifier: Based on the KI Configuration this drop-down populates, select a Cell Identifier.
- Entity Name: Select an Entity Name.
- *Current Date: Select a Date on which the assessment has been done.
- Variance %: Select a variance %
- Variance Amount Between: Enter the Variance Amount Range.
- Breached: Select 'Yes' or 'No' or both.
Note:
Ensure you have configured the Key Indicators. Refer to the Configure a Key Indicator Section.- Click Apply to generate the reports.
- Click Reset to reset the values.
The generated report contains the following details:
- Report Code: Provides report code of the cell.
- Schedule Code: Provides schedule code of the cell.
- Cell Identifier: Provides the MDRM code of the cell.
- Cell Line Item: Provides line item of the cell. To display the line item data must be maintained in the FSI_REG_CELL_LINE_ITEM table.
- Cell Description: Provides the description of the code.
- Entity: The entity for which the assessment was done.
- Current Value: Provides the current value of the assessment.
- Previous Value: Provides the previous value of the assessment.
- Variance: Provides the difference between the current and previous values.
- Variance %: Provides the percentage value of the variance.
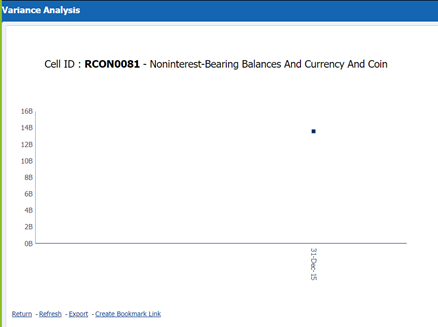
- Trend: Displays the graphical representation of the assessment across time.
You can select between:
- Trend for All Dates
- Trend for Date Range
Note:
Trend graphs can be exported to PDF and Excel.
Figure 16-53 Variance Analysis for Prior Periods

Figure 16-54 Trend
