5.6.1.9.6 Using Graph Toolbar
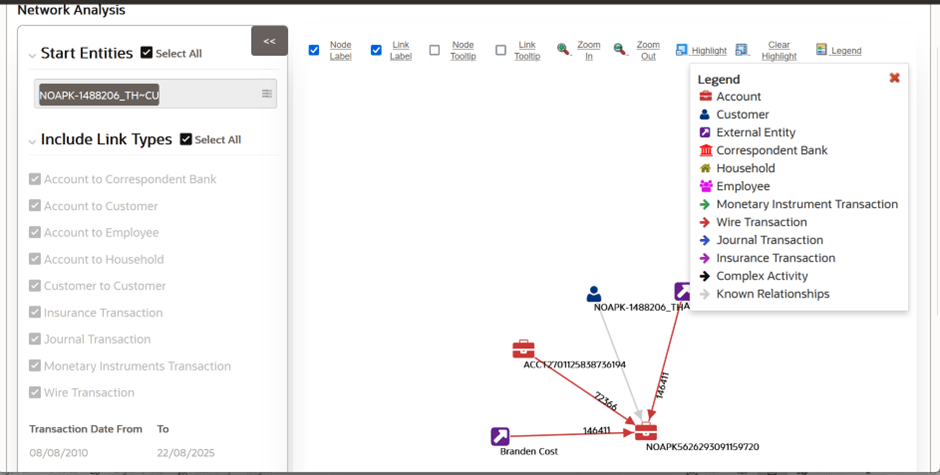
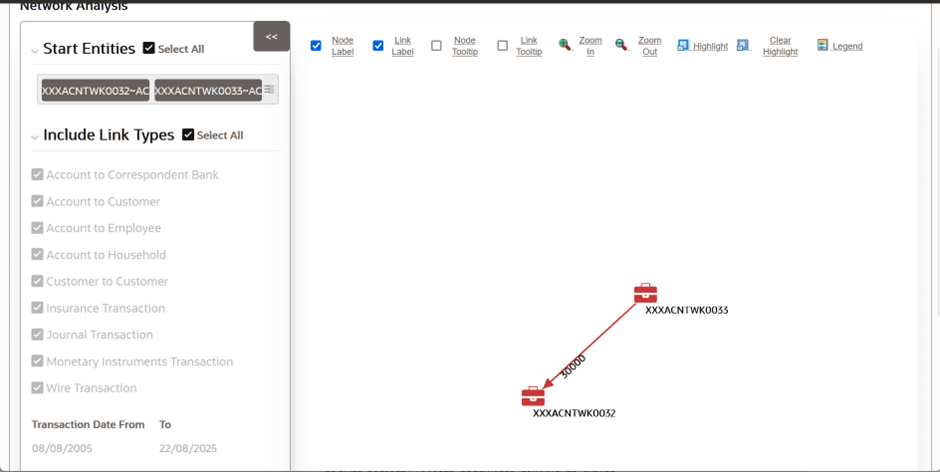
The Graph Toolbar allows you to perform general operations associated with the graph. It displays on the top of the Network Graph page. You can select different toolbar options such as Node Label, Link Label, and so on.
To use the graph toolbar, follow these steps:
- Navigate to the Network Graph page.
- You can perform the following actions using the Graph Toolbar:
- Viewing Node Label: Select the Node Label checkbox to view a label for
each node on the graph. The Node Label displays in the following format
- NodeType:NodeID.
Node Type represents - the type of entity.
Node ID represents- the identifier of the entity represented by this node.
- Viewing Link Label: Select the Link Label checkbox to view a label for each link on the graph. The middle of each link is labeled with the sum of the amount of all transactional links between the nodes. That is, if there is a transaction between nodes (such as a transfer of funds from one account to another), the total amount of all transactions, across all transactions types, between these nodes displays. When links between nodes are non- transactional links, the Link Label does not display.
- Viewing Link Tooltip: Select the Link Tooltip checkbox to view
additional information about the link by mouse over on the graph. A link
tooltip displays the following information:
<From Node>: The identifier of the entity represented by the first node. Link Direction Arrow: The direction of the relationship between nodes.
One way ----> or <--------- Displays when one node has a transactional link.For example,the
From Node has sent funds to the To Node.
Bi-directional <------ >: Displays when both nodes have a transactional link. For example, the
From Node has both sent and received funds from the To Node.
Non-directional--------- Displays when the nodes have shared attributes, but no transactional
link. For example, nodes share a common address.
- <To Node>: The identifier of the entity represented by the second node.
- Shared Attributes: Information or attributes, two nodes have in common, such as a common address, phone number, or tax ID.
Figure 5-30 Graph Toolbar

- Viewing Node Label: Select the Node Label checkbox to view a label for
each node on the graph. The Node Label displays in the following format
- NodeType:NodeID.
- Viewing Node Tooltip: Select the Node Tooltip checkbox to view additional
information (in the form of a tooltip) about the node by mouse over on the
graph. A node tooltip displays the following information:
- Node Type: The type of entity
- Node ID: The identifier of the entity represented by this node
- Total Amount: Sum of the transaction amount of all links involving this node within the network
- Incoming Amount: Sum of the transaction amount of all links going into this node within the network
- Outgoing Amount: Sum of the transaction amount of all links going out of this node within the network.
Figure 5-31 Node ToolTip screen

- Zooming In: To view the objects closely on the Graph Tool page, click the Zoom In. You can also use your mouse wheel to zoom in.
- Zooming Out: To view the objects from far on the Graph Tool page, click the Zoom Out. You can also use your mouse wheel to zoom out.
- Using Highlight: To highlight nodes or links, follow these steps:
- Click Highlight. The Highlight dialog box displays. This box
allows a user to locate nodes and links on the network graph.
- To locate a node or link, select Node or Linkoptions using the radio buttons.
- Enter the node or link business unique identification number in the Value Contains field or select from drop-down list.
- To select more than one node, hold down the Shift key, and click Nodes inside the selection box. The text box includes a wildcard search feature. The text box applies the wildcard search automatically, you need not add any wildcard characters before or after the text entered in this text box. Blank space before or after the text entered in the text box is considered part of the search criteria.
- Click Apply. Nodes that match the search criteria are visually distinguished on the graph by placing a blue border around them. Links that match the search criteria are visually distinguished on the graph by making the link line thicker.
- To clear highlights on the Graph Tool page, click Clear Highlight. All visual distinctions made on the graph as a result of using the Highlight feature are cleared.
- ViewingLegend: To view various graphical components of the Network Graph page, click Legend. The Legend dialog box displays which provides a dynamic indicator of nodes and links that are visible in the graph.