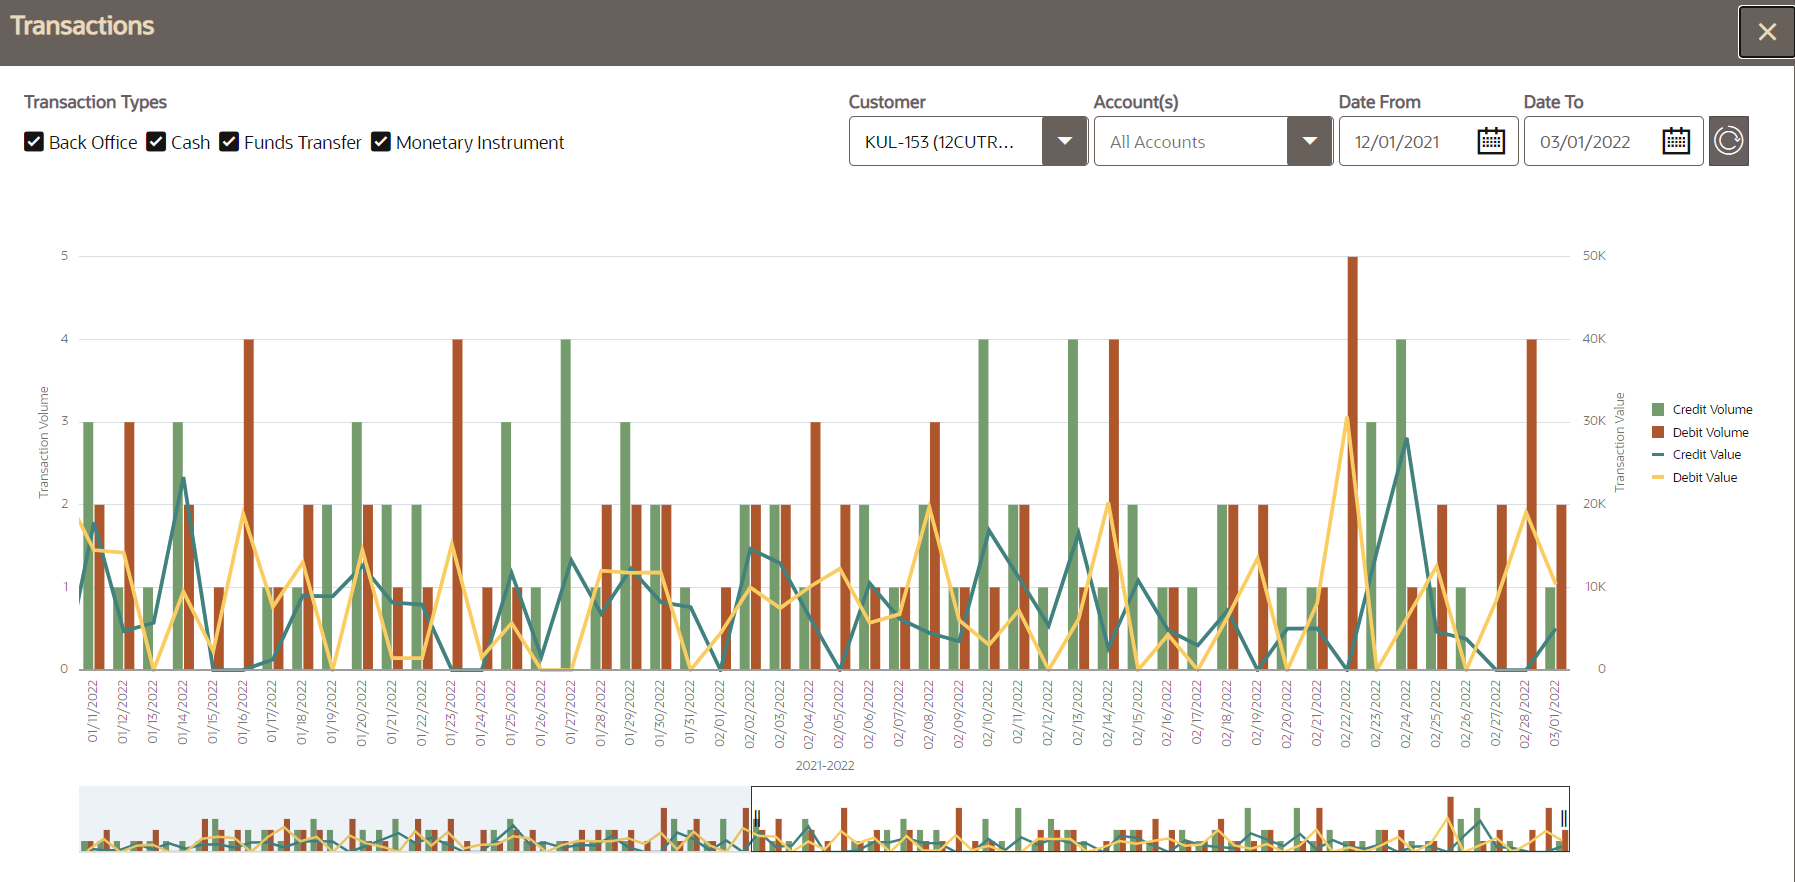
20.27 Transaction Chart Configuration
This section describes the Transaction Chart Configuration.
The Transaction Chart displays a graphical representation of all the transactions for all
the customers involved in the selected case within the defined time period. This helps
investigators identify patterns of expected customer activity.

Figure 20-40 Transaction Chart

This chart can be configured in the KDD_INSTALL_PARAM table of the Atomic schema using Param ID 3014.
Table 20-22 Transaction Chart
| Parameter Name | Default Value | Description |
|---|---|---|
| ECM Transaction Chart | Y | The value of this parameter specifies whether Transactions chart should be displayed or not in Transactions tab. The parameter value can have only Y or N value. If set to Y, Transactions chart will be displayed in Transactions tab. If set to N, Transactions chart will not be displayed in Transactions tab. |
| ATTR_1_CD: TRANS_SRCH_DFLT_DT_RANGE | 3 | The value of this attribute specifies the number of months (Date Range) allowed between Date From and Date To date fields for default search in Transactions Chart on the Transactions tab. This attribute accepts only natural numbers. |
| ATTR_2_CD: TRANS_SRCH_DT_RANGE | 12 | The value of this attribute specifies the number of months (Date Range) allowed between Date From and Date To date fields for manual search in Transactions Chart on the Transactions tab. This attribute accepts only natural numbers. |