11.5.1.3 Key Trends Dashboard

Figure 11-14 Management Reporting - Key Trends - Key Trends
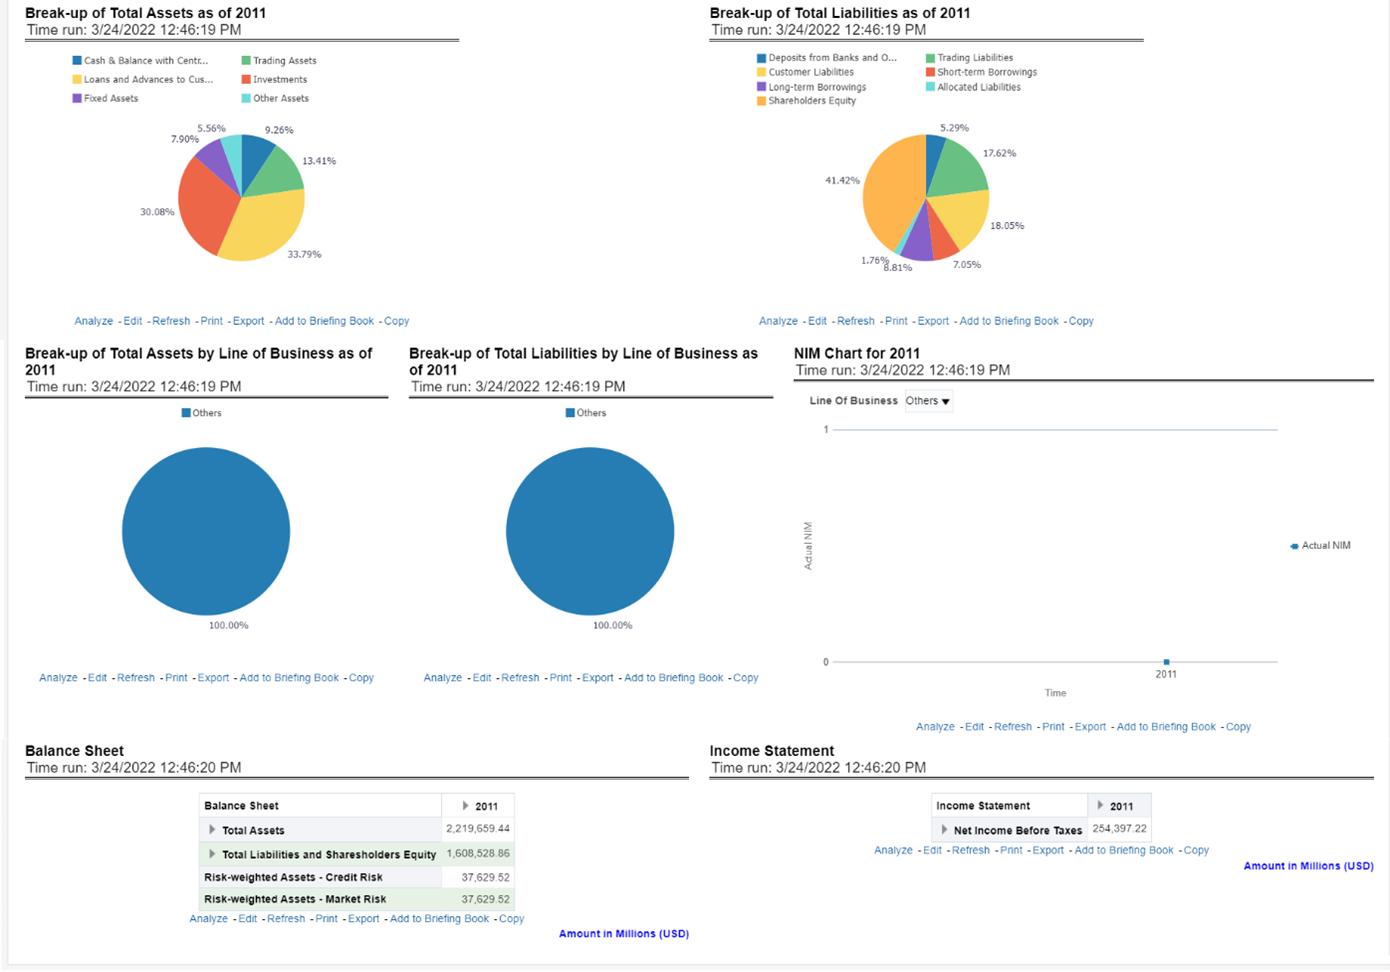

The Management Reporting - Key Trends - Key Trends report displays the Break up of Total Assets and Liabilities as of date in pie charts. This report also displays the Break up of Total Assets and Liabilities by Line of Business as of date in graph form. And this report displays the Balance Sheet and Income Statement in tabular format.

Figure 11-15 Management Reporting - Key Trends - Net Loss Analysis
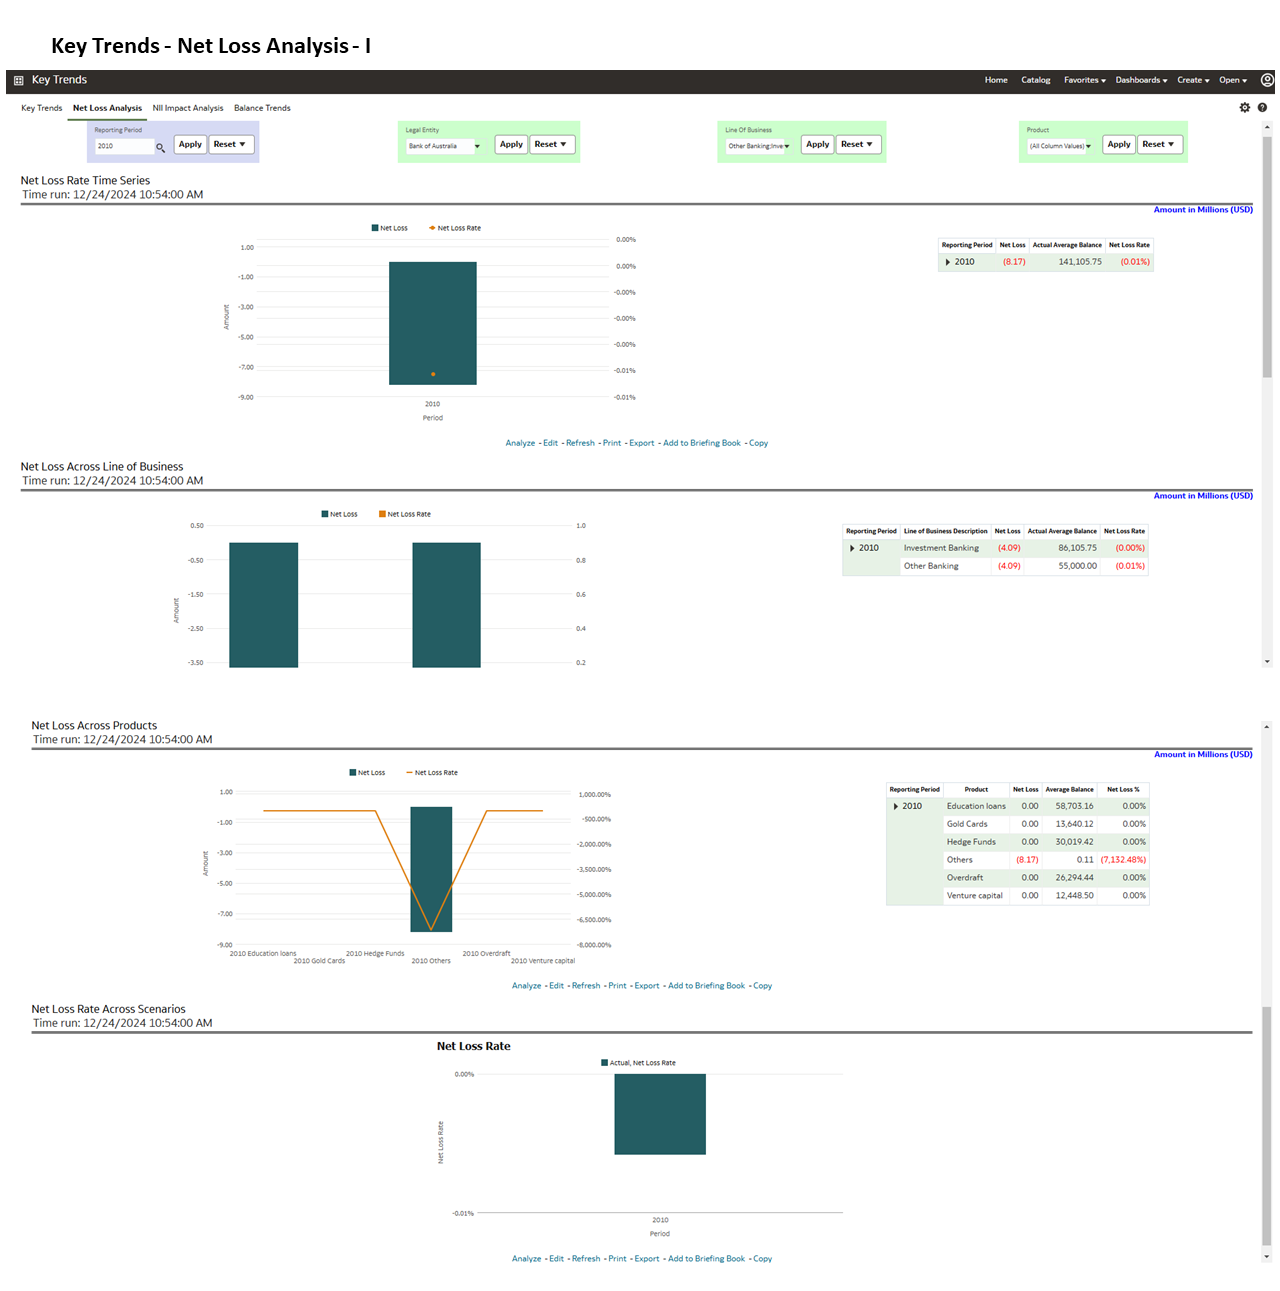

The Management Reporting - Kay Trends - Net Loss Analysis Report displays the Net Loass Rate Time Series, Net Loss Across Line of Business, and Net Loss Across Scenarios in graphical format.

Figure 11-16 Management Reporting - Key Trends - NII Impact Analysis
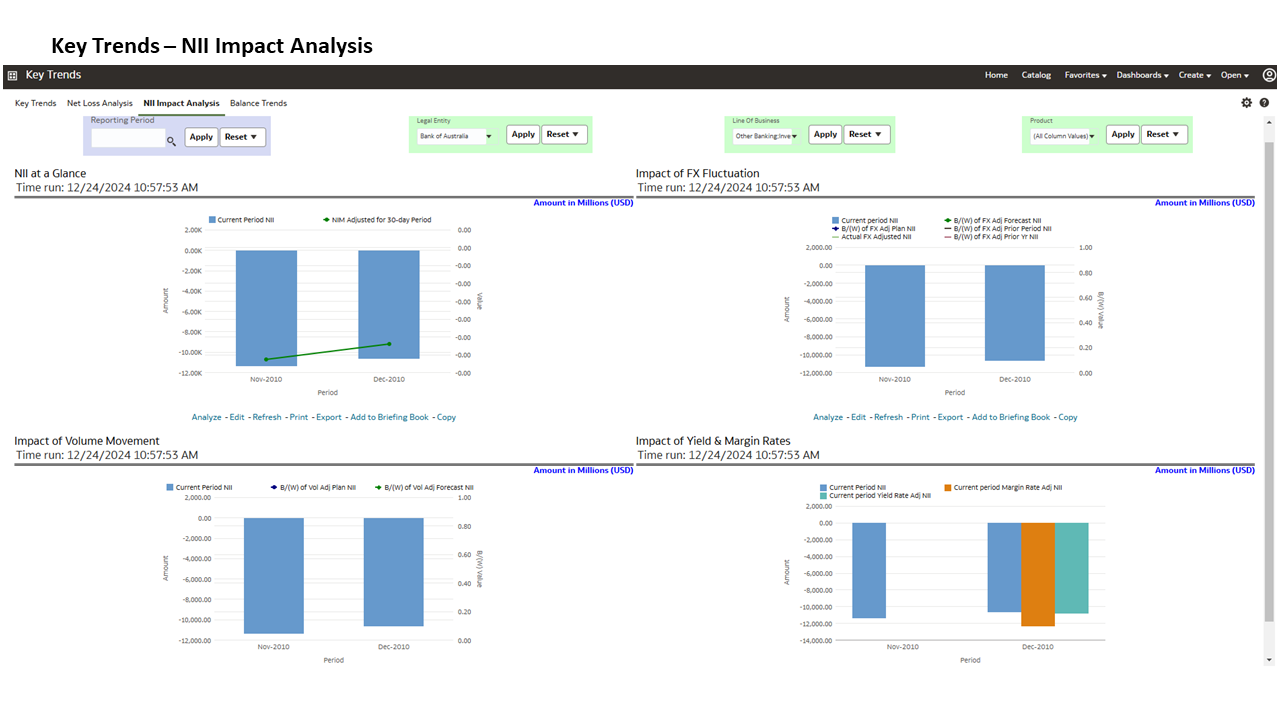

The Management Reporting - Key Trends - Net Interest Income (NII) Report displays the NII at a Glance, Impact of FX Fluctuation, Impact of Volume Movement, Impact of Yield & Morgin Rates in graphical format.

Figure 11-17 Management Reporting - Key Trends - Balance Trends


The Management Reporting - Key Trends - Balance Trends Report displays the balances in tabular format.