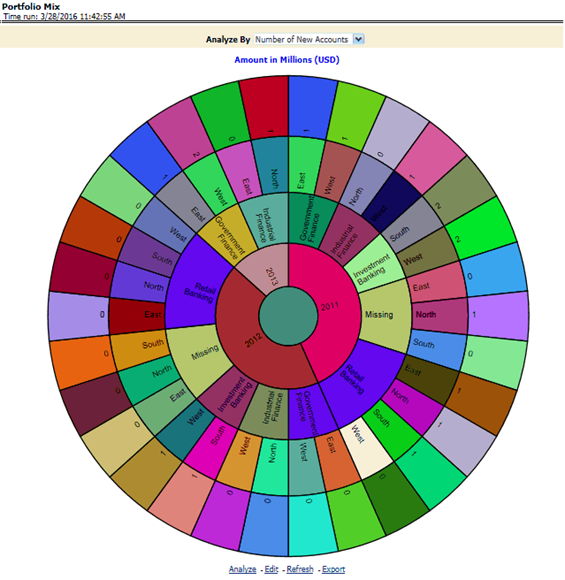
Portfolio Mix
This report displays the growth of key metrics such as No. of New Accounts, End of Period balance, and Sales across various Lines of Businesses within the bank. This is a sunburst report.
On clicking a particular distribution, a consolidated view of that particular distribution is displayed. For example, if you need to get a consolidated view of 2011 distribution, click on 2011. You get consolidated data of 2011 distribution on open customers, Line of Business, constituent products, and corresponding revenue. Further, you can get a consolidated view of open customers, Line of Business, constituent products, and corresponding revenue, by clicking any particular distribution. To view the overall report, click the center of the circular graph.
Figure 4-2 Portfolio Mix – Sunburst Report
