4 Canvases, Canvas Filters, and their Use

The Canvases available in a particular DV Story are visible in the bottom left part of the screen. For example, in the Business Performance Analyzer Story, there are the following Canvases:

  • Summary
  • Analyze by Time
  • Analyze by LOB
  • Analyze by Product
  • Analyze by Channel
  • Analyze by Region

Figure 4-1 Business Performance


This header row displays the available Canvases in the DV Story.

The IPA and RPA DV Reports enable several filters at the canvas level for detailed analysis. The Canvas Level Filters allow the Business User to do detailed analysis by splitting the data across various dimensions.

The filters differ across canvases. The Sample Filters from the Business Performance Analyzer are as follows:

Figure 4-2 Summary Canvas


This part of the OFS Institutional Business Performance Analyzer displays the filters of the Canvas.
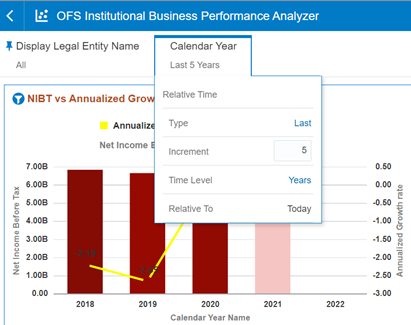
Note the relative time prompt highlighted above acts as a primary filter of the data. On clicking the filter prompt, the below menu is exposed. As seen, the prompt allows to change the relative time period into months, quarters, and years, and also to select the number of time periods to look up in the past.

Figure 4-3 OFS Institutional Business Performance Analyzer
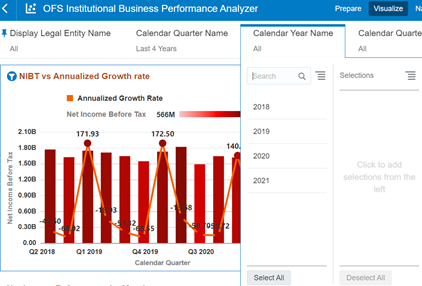

This OFS Institutional Business Performance Analyzer screen displays the way to select the Calendar Year.

Figure 4-4 Time Canvas


This OFS Institutional Business Performance Analyzer screen displays the Visualization of the Time Canvas.

Unlike the other canvases, the Time Canvas allows for splitting the data across different time reference points – Years, Months, and Quarters.

Figure 4-5 OFS Institutional Business Performance Analyzer


This part of the screen displays the way Time Canvas allows to split the Data across different Time Reference points.

Figure 4-6 OFS Institutional Business Performance Analyzer – Visualize Tab
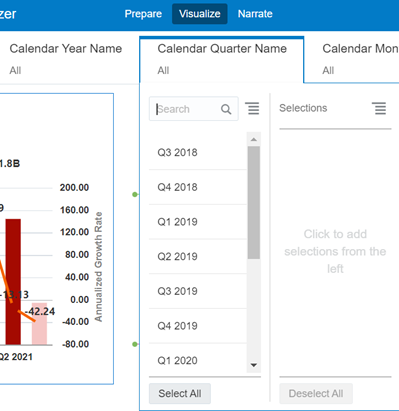

This tab displays the Visualization of the different Time Reference Points by Quarters. It is also possible to display the Time Reference Points by Months or Years.

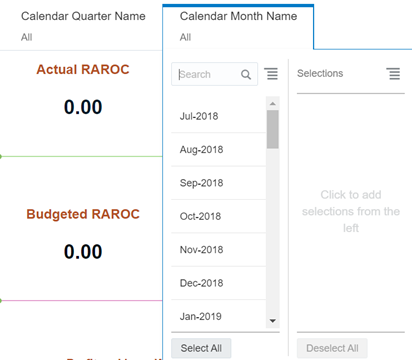
Figure 4-7 Calendar Month Name


This tab displays the Visualization of the different Time Reference Points by Calendar Months.

Respective time selections will be reflected on the Right-Hand Side Box. Multi-select is supported and values can easily be deselected for new analyses.