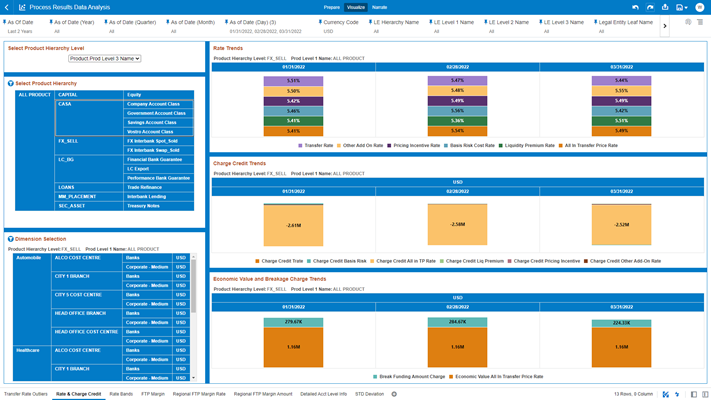
4.1.5.1.5 Rate & Charge Credit
The “Rate & Charge Credit” Report provides the trend of the Transfer Price calculation metrics with respect to As-of-Date.
You can use a series of Report Prompts, as previously described, to filter the data according to key Attributes pertaining to the underlying Instrument level data.
The report displays the underlying data according to the following Charts’ logic:
- Select Product Hierarchy Level: The chart provides you with a selection capability for the desired Product Hierarchical level.
- Select Product Hierarchy: The chart provides you with three levels of the hierarchy – the selected level from the “Select Product Hierarchy level” as well as the Product Level 1 Name and Product leaf nodes (Product Leaf Name). You use this chart to further filter down the “Rate & Charge Credit” canvas charts.
- Dimension Selection: The chart provides you with selection capability on the available Dimension of Analysis – the available dimensions for selection are Industry Leaf Name, Org unit Leaf Name, Customer Type Name, and Currency Code. You use this chart to further filter down the “Rate & Charge Credit” canvas charts.
- Rate Trends: The chart reports the trend analysis of the
Rates with respect to As-of-Date.
The columns displayed in the chart are as follows:
- As Of Date
- Transfer Rate
- Other Add On Rate
- Pricing Incentive Rate
- Basis Risk Cost Rate
- Liquidity Premium Rate
- All In Transfer Price Rate
- Charge Credit Trends: The chart reports the trend analysis of
the Charge Credit with respect to As-of-Date.
The columns displayed in the chart are as follows:
- Currency Code
- As Of Date
- Charge Credit Trate
- Charge Credit Basis Risk
- Charge Credit All in TP Rate
- Charge Credit Liq Premium
- Charge Credit Pricing Incentive
- Charge Credit Other Add-On Rate
- Economic Value and Breakage Charge Trends: The chart reports
the trend analysis of the Charge Credit with respect to As-of-Date.
The columns displayed in the chart are as follows:
- Currency Code
- As Of Date
- Break Funding Amount Charge
- Economic Value All In Transfer Price Rate
Figure 4-102 “Rate & Charge Credit” Report canvas
