4.1.5.1.11 STD Deviation
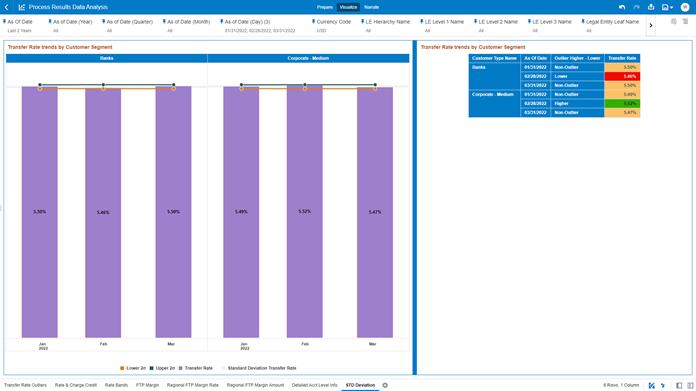
The “STD Deviation” Report highlights the Transfer Rate Outliers that are calculated using the Standard Deviation capability available off the shelf with Oracle Analytics.
The Transfer Rate pertaining to the Instrument level data is segregated between “Non-Outlier”, “Higher”, and “Lower” in the report column “Outlier Higher – Lower”.
You can use a series of Report Prompts, as previously described, to filter the data according to key attributes pertaining to the underlying Instrument level data.
The report displays the underlying data according to the following Charts’ logic:
- Transfer Rate trends by Customer Segment: (the chart is
available in both bar and tabular formats): The chart reports the trend
analysis of the Transfer Rate with respect to As-of-Date.
The columns displayed in the bar chart are as follows:
- Customer Type Name
- As Of Date
- Lower 2σ – the Transfer Rate STD Deviation value calculated for 2 sigma on the lower band
- Upper 2σ – the Transfer Rate STD Deviation value calculated for 2 sigma on the upper band
- Transfer Rate
The columns displayed in the tabular chart are as follows:
- Customer Type Name
- As Of Date
- “Outlier Higher – Lower” – defines if a Transfer Rate value, for each combination of Dimensional Values and As of Date, is Higher, Lower or Non-Outlier based on the STD Deviation calculation (labelled as “Higher” when the Transfer Rate is greater than the 2 sigma for the STD Deviation on the upper band, “Lower” when the Transfer Rate is lower than the 2 sigma for the STD Deviation on the lower band, and Non-Outlier when the Transfer Rate is within the range of the STD Deviation for“+2 sigma” and for “-2 sigma”)
- Transfer Rate
Figure 4-107 “STD Deviation” Report
