4.7 Business Review Canvas
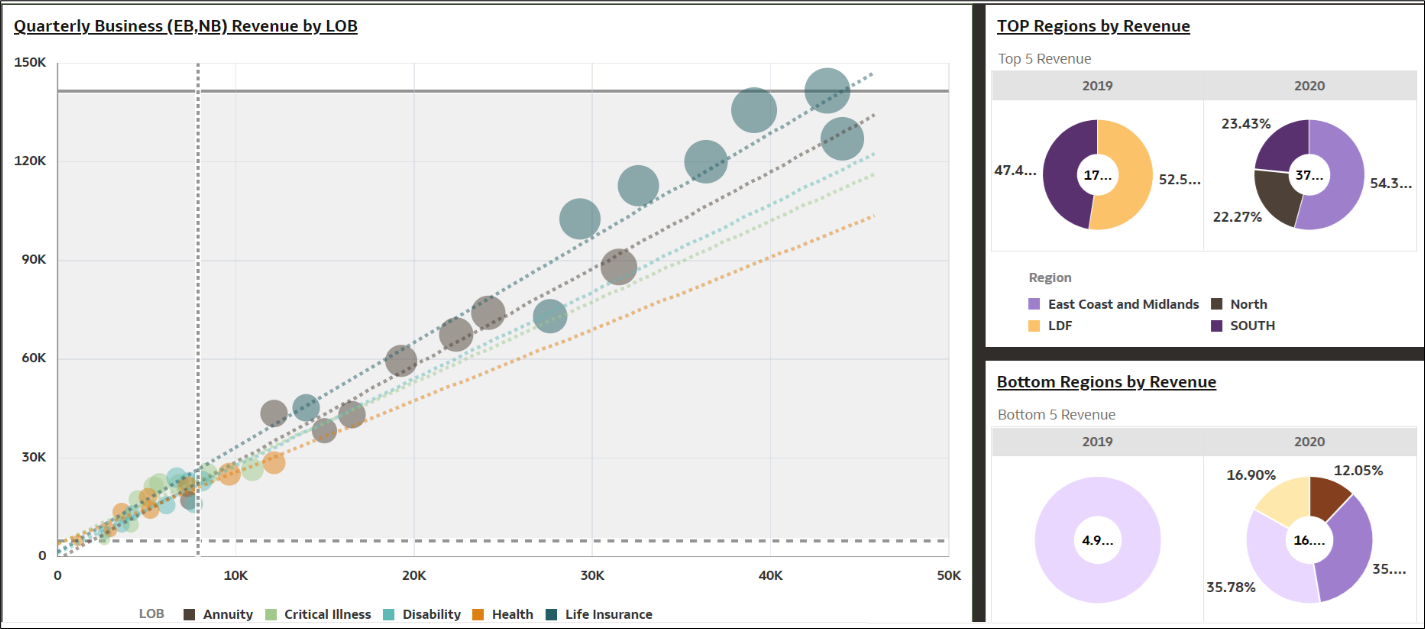
The Business Review canvas gives snapshot of business performance and business status in terms of revenue quarter wise. Each report can further be rendered and generated by selecting combination of filters at the top canvas level filters like FIC MIS Date, LE, Region, LOB up till product granularity.
This bubble business revenue by LOB where the bubble size=size of the revenue, each of these business line shows a trendline. This report can be can further be rendered and generated by selecting combination of filters at the top canvas level filters like FIC MIS Date, LE, Region etc.
Figure 4-45 Business Review Canvas

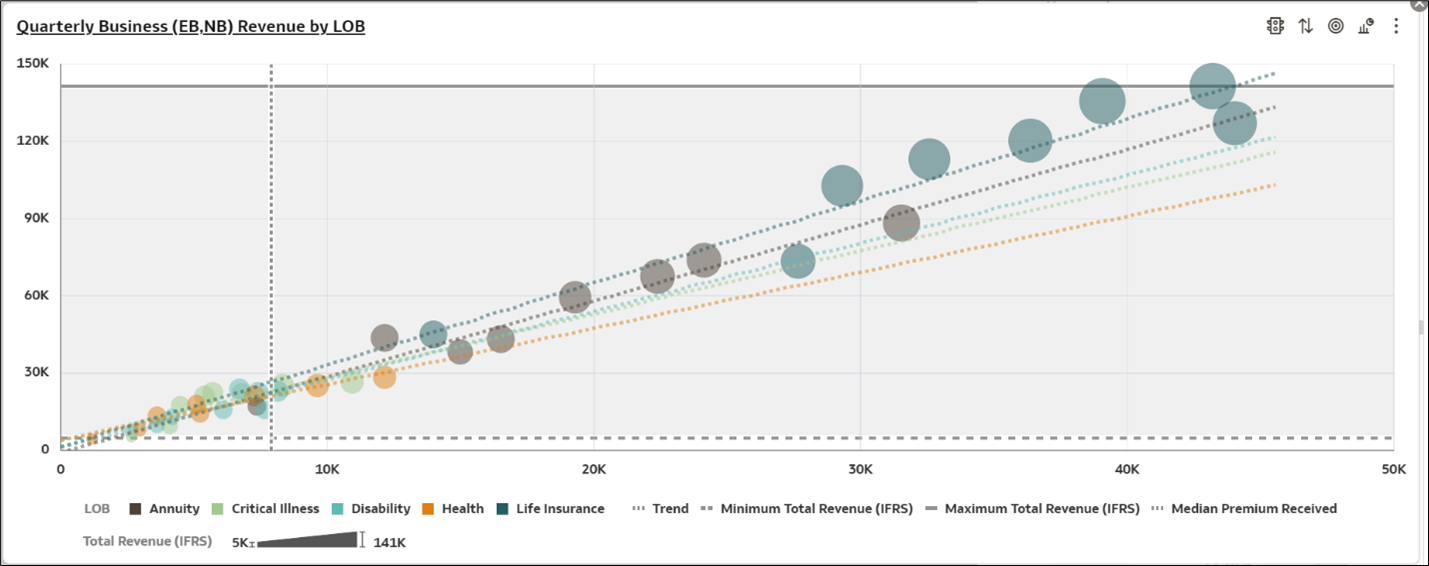
Quarterly Business Review by LOB, By Business Type
This Bubble Chart shows Quarterly Business status for both existing and new business. Each bubble represents a Line of business and the sizes of the bubble depend on the volume of total revenue. This report can be further analyzed by selecting canvas level drop down filter conditions.
Figure 4-46 Quarterly Business Review by LOB, By Business Type

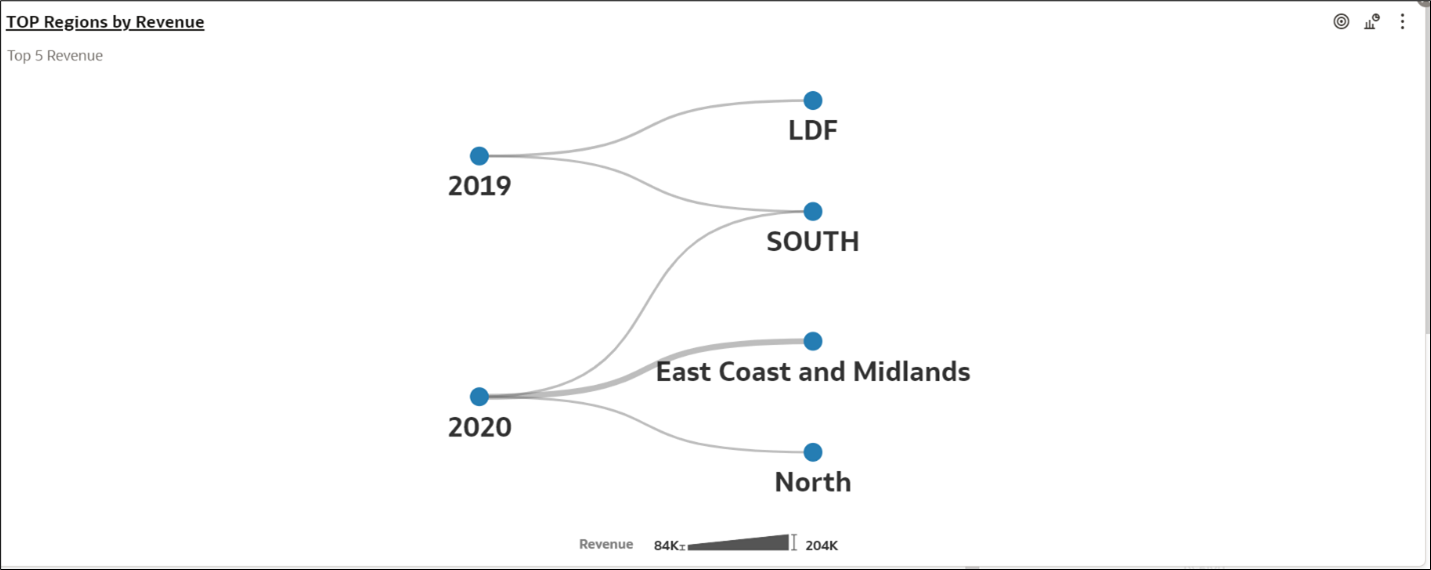
Top Regions by Revenue
This report analyses top performing regions in terms of business revenue.
Figure 4-47 Top Regions by Revenue

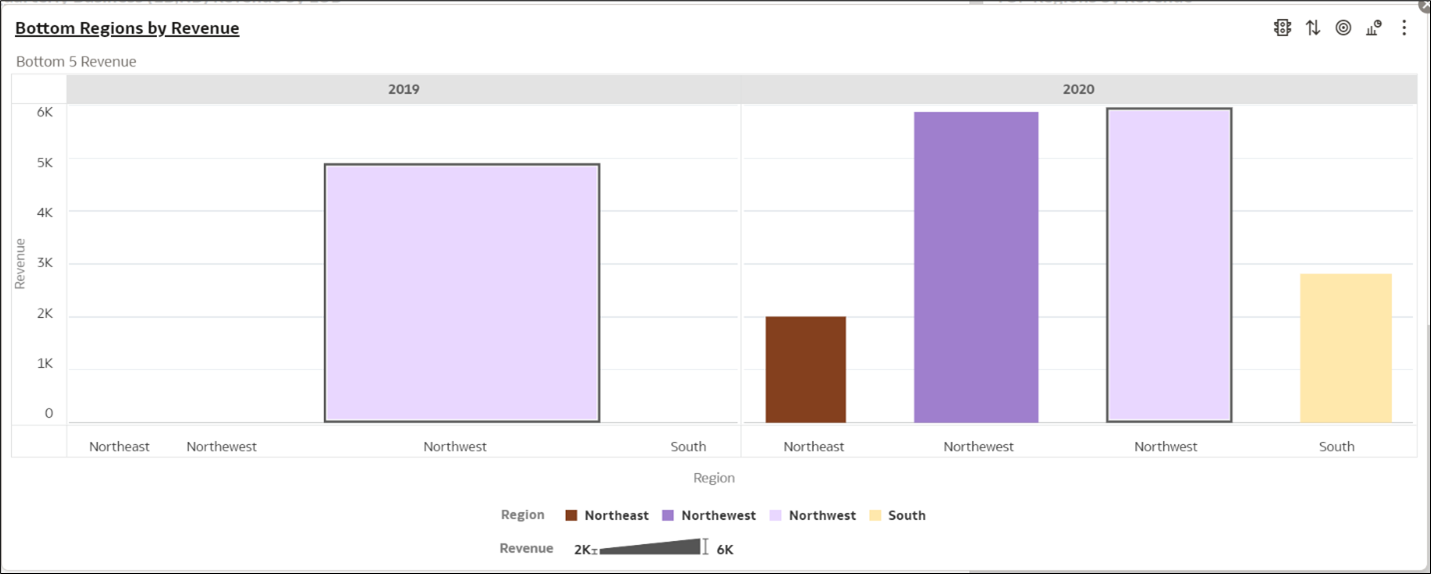
Bottom Regions by Revenue
This report analyses least performing regions in terms of business revenue.
Figure 4-48 Bottom Regions by Revenue
